GPF User Interface
This guide provides a brief overview of the GPF user interface and the available tools.
Upon accessing the GPF instance, the user is greeted by the Home page, which includes a brief description of the instance(fig. 1.1), a shortcut to the Gene Profiles tool(fig. 1.2), and a list of all configured datasets (fig. 1.3). Each dataset represents a group of families along with the available phenotypic and/or genotypic data for their members. Next to each dataset the user can find a set of icons(fig. 1.4) providing useful details such as the presence of de novo or transmitted variants, the availability of phenotype data, and other relevant information. Note that access to some of the datasets may be restricted; users may log into their account or contact an administrator if access has not yet been granted. The top bar(fig. 1.5) can be used to navigate between different pages of GPF.
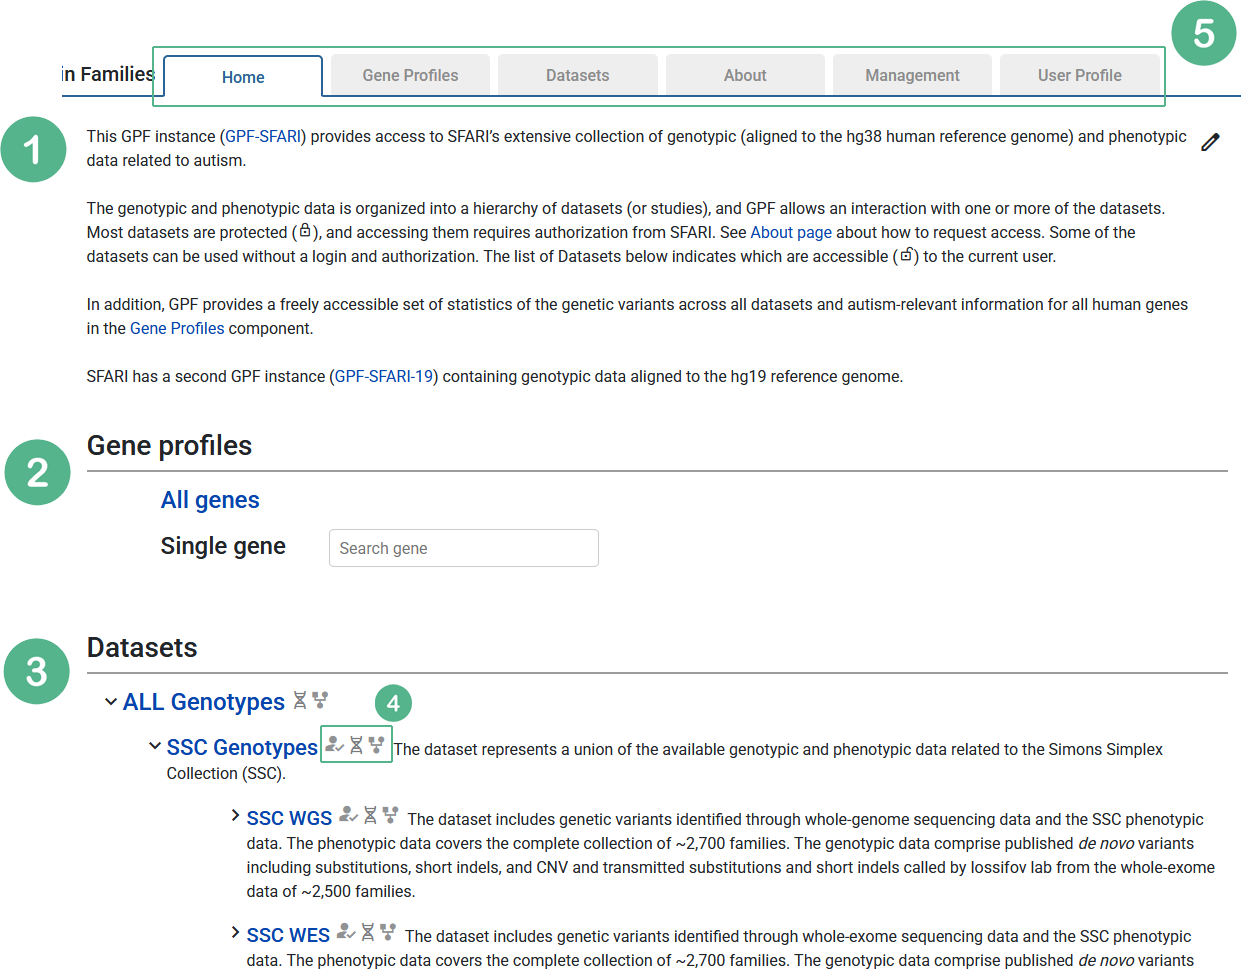
Figure 1
On the datasets page, the user can click on the dataset dropdown menu in order to navigate between different datasets.
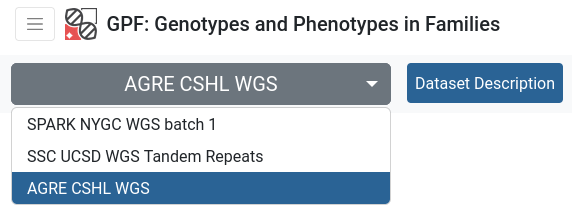
Each dataset has its own selection of available tools, which are organized as tabs. The availability of these tools depends on the configuration of the dataset.

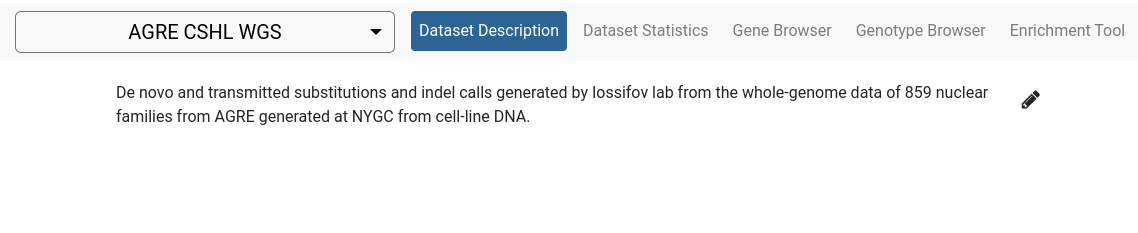
Dataset Description
The Dataset Description tool provides an overview of a dataset. It can contain information such as the reasons it was made, its size and scope, details of the technology used to generate its data, rules for access, relevant references and etc.
The description is in Markdown format and can be edited directly from the browser.
Dataset Statistics
The Dataset Statistics tool provides various overviews of the families in the dataset. Download is available for all pedigree files in a .ped format.
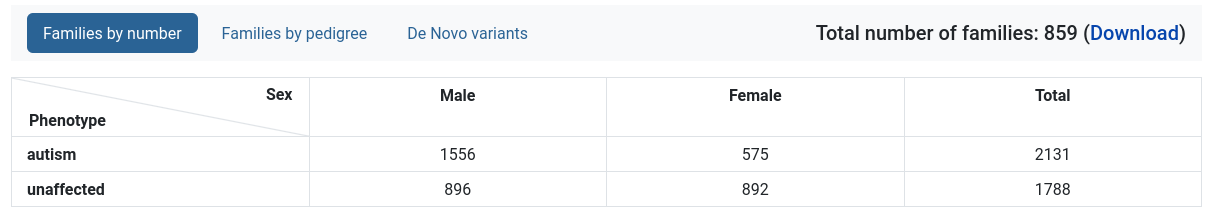
Families by number
A table with the amount of individuals, separated by phenotype and sex.
Families by pedigree
This view presents a table listing all observed pedigree types along with the number of families for each. Each pedigree is clickable, revealing the corresponding family IDs and a download link.
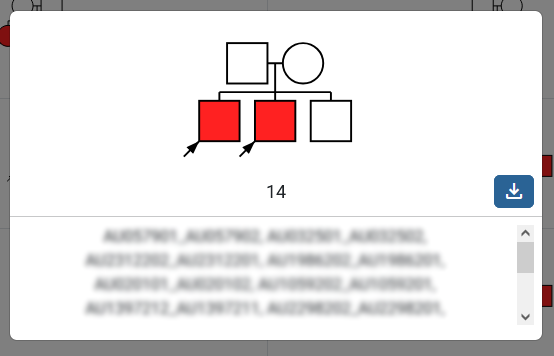
The table can be filtered by various tags available at the upper-left corner (fig. 2.1, 3). The filtered families can then be downloaded via the download button (fig. 2.2). Additionally, a legend describing the phenotypes can be toggled from the bottom-right corner (fig. 2.3).
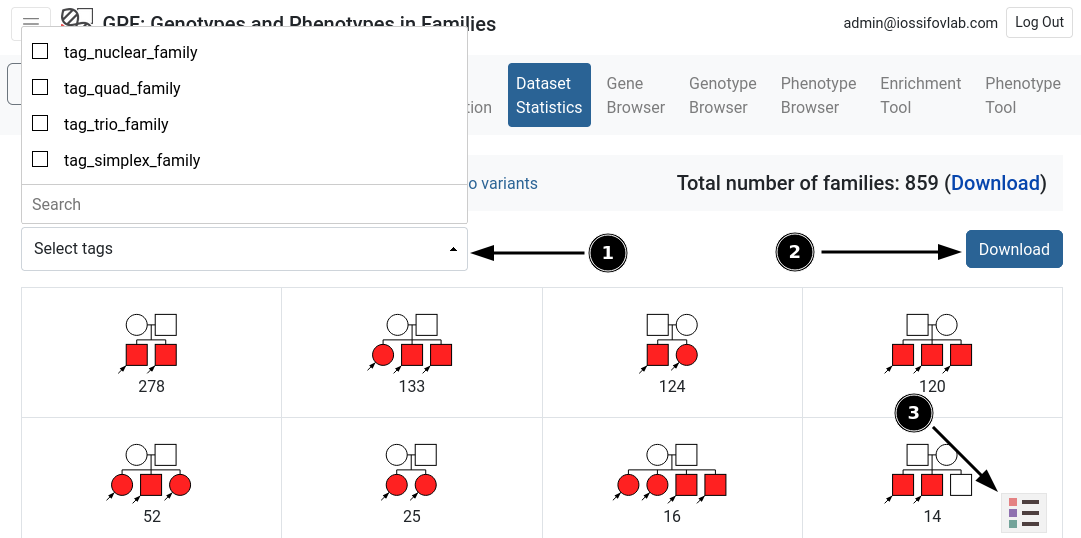
Figure 2
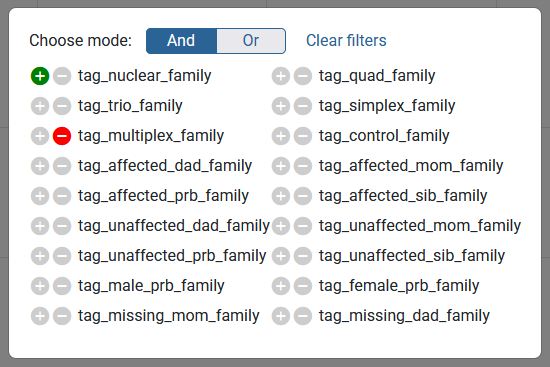
Figure 3
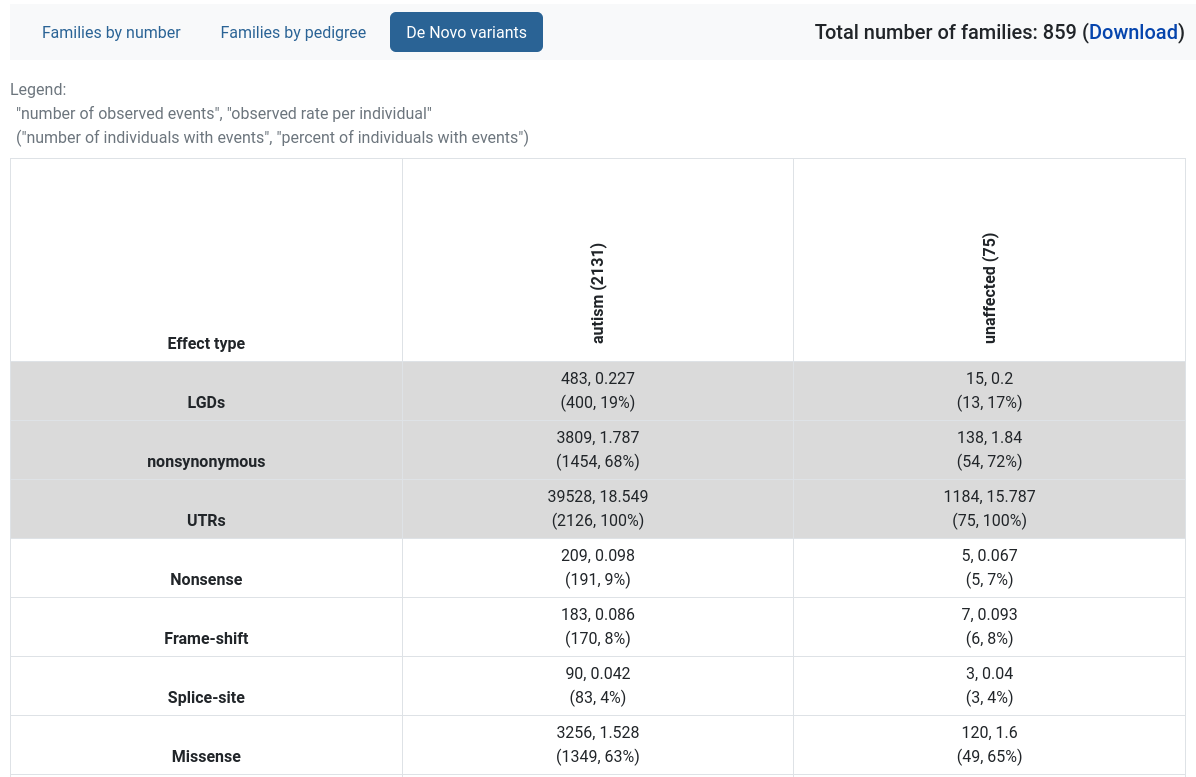
De Novo variants
Provides a table with the rates of de novo variants, split by variant effect type and the individual’s diagnosis.
Gene Browser
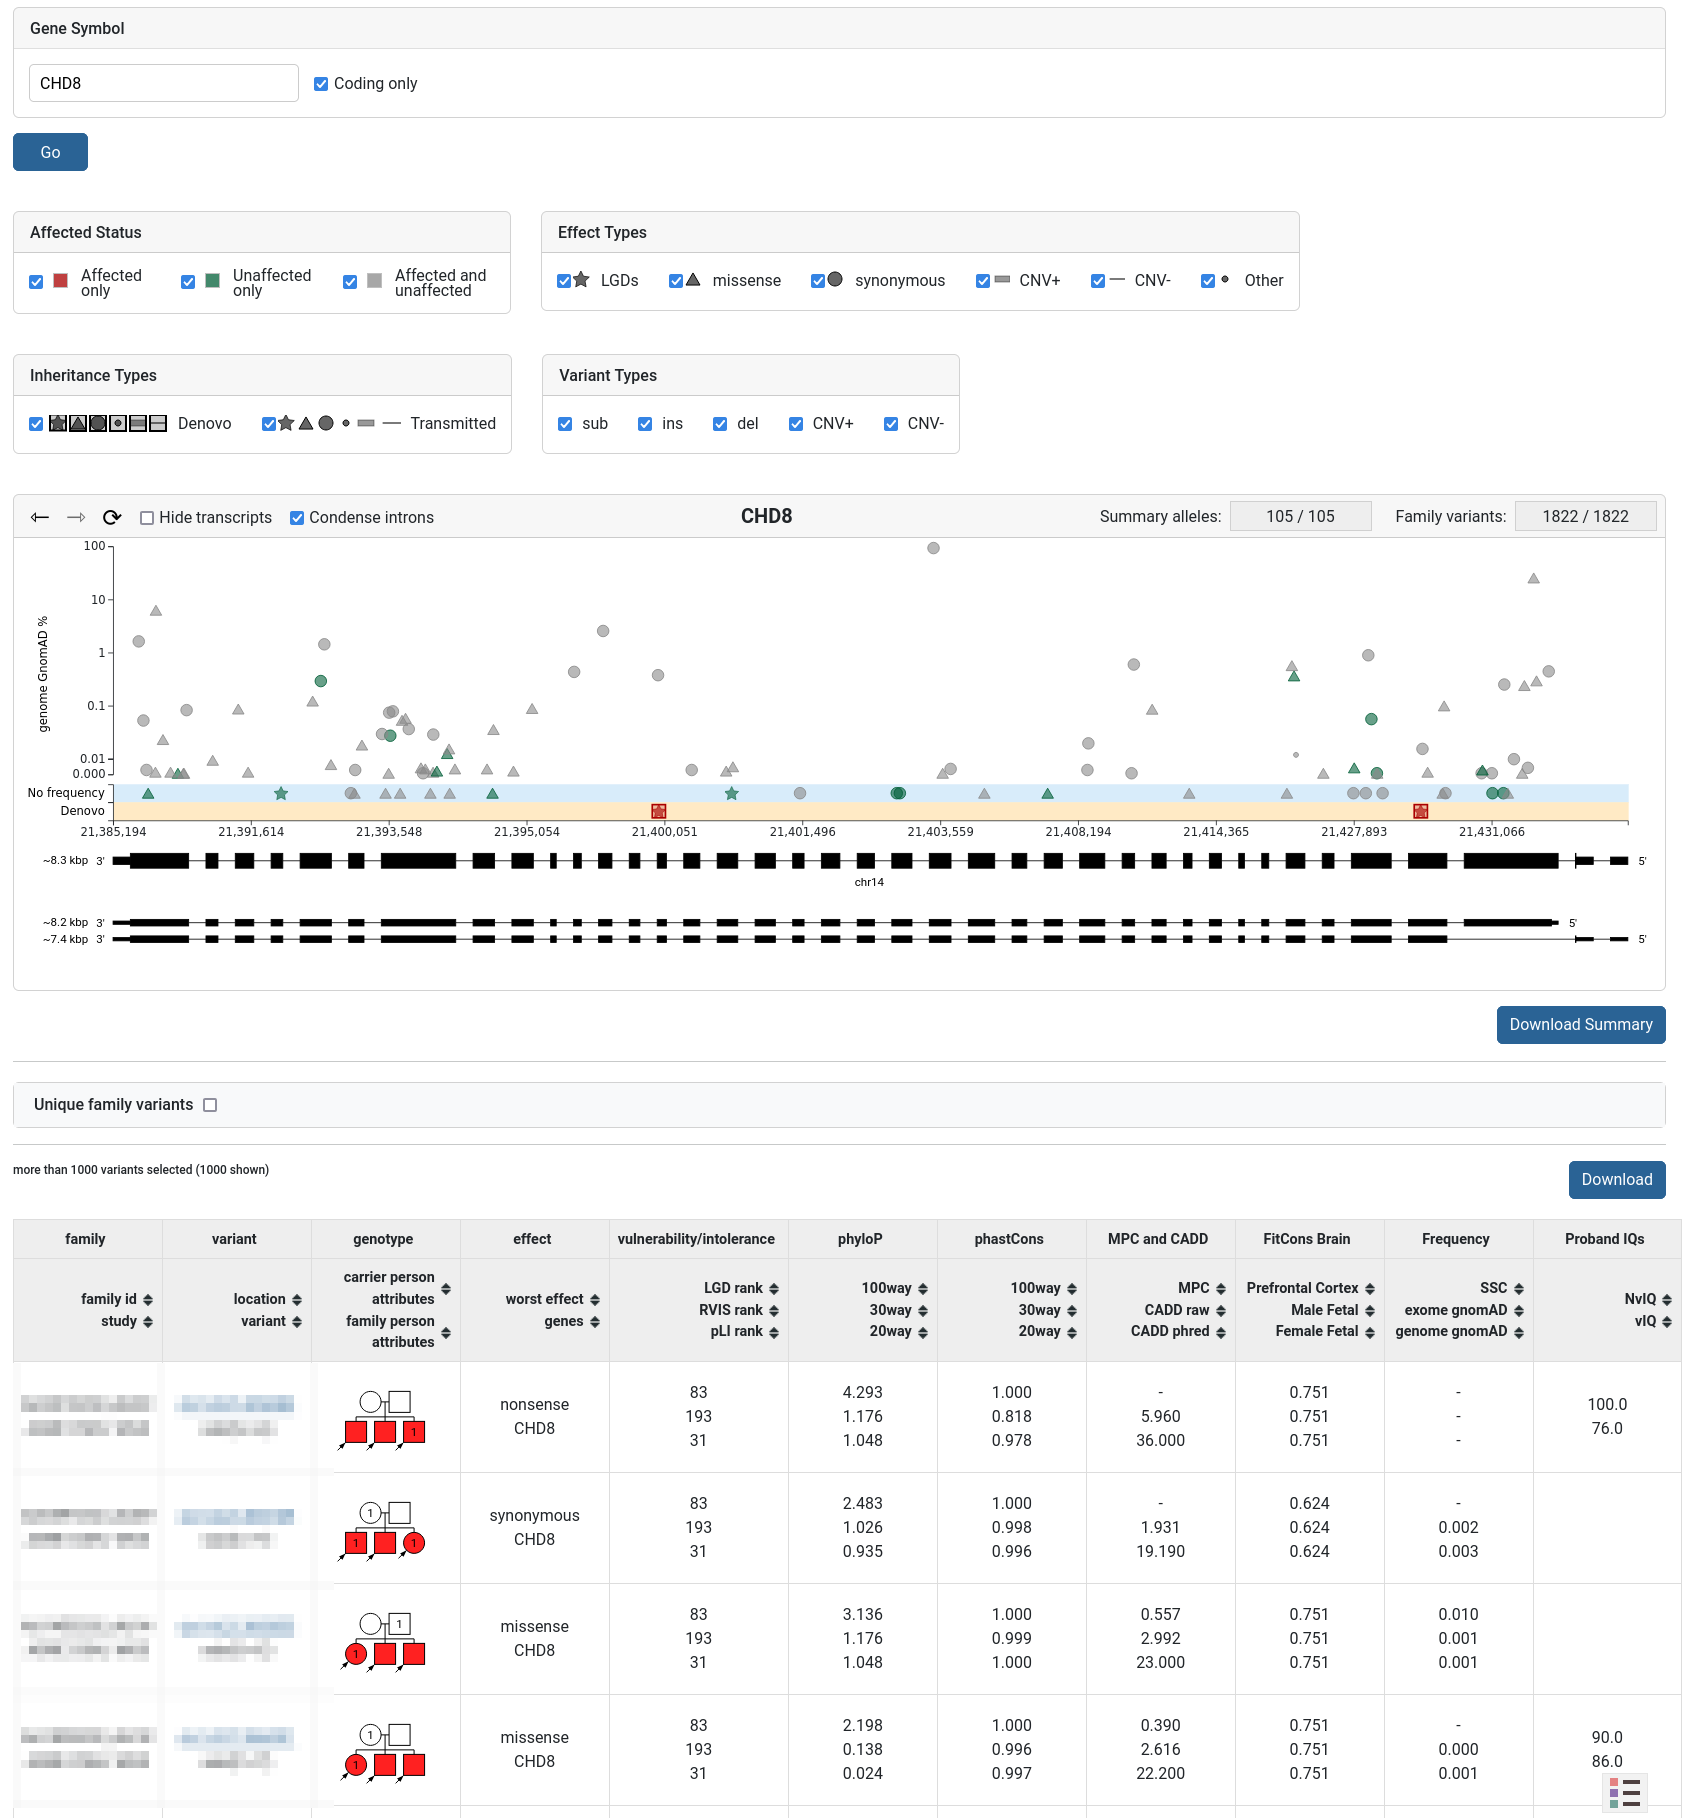
The Gene Browser tool can be used to graphically display a gene’s structure (exomes, introns, transcripts) and the dataset’s variants found on it.
The variants can be filtered by different properties. The user can hover over each variant on the plot to show additional information. The plot can be zoomed (by click-and-drag) to select specific variants in a region. Below the plot is a table showing the currently selected variants. Two download buttons are provided - for summary and family variants.
Genotype Browser
The Genotype Browser tool provides a powerful query interface to the dataset’s genetic variants. Users can filter by properties of the variants, such as:
Their type (SNP, short indel, CNV)
Their effect on proteins (i.e. missense, synonymous, LGD, etc.)
Whether they are de novo or transmitted, and their frequency
Genomic scores assigned to variants (i.e. phyloP, CADD, MPC, etc.)
The genes targeted by the variant and the family the variant occurs in
Additionally, the user can filter by properties of the target genes, such as:
Protection scores (pLI, RVIS, etc.)
Pathway membership
SFARI Gene score and phenotypic properties associated with individuals in the dataset families
More information on the filters can be found here.
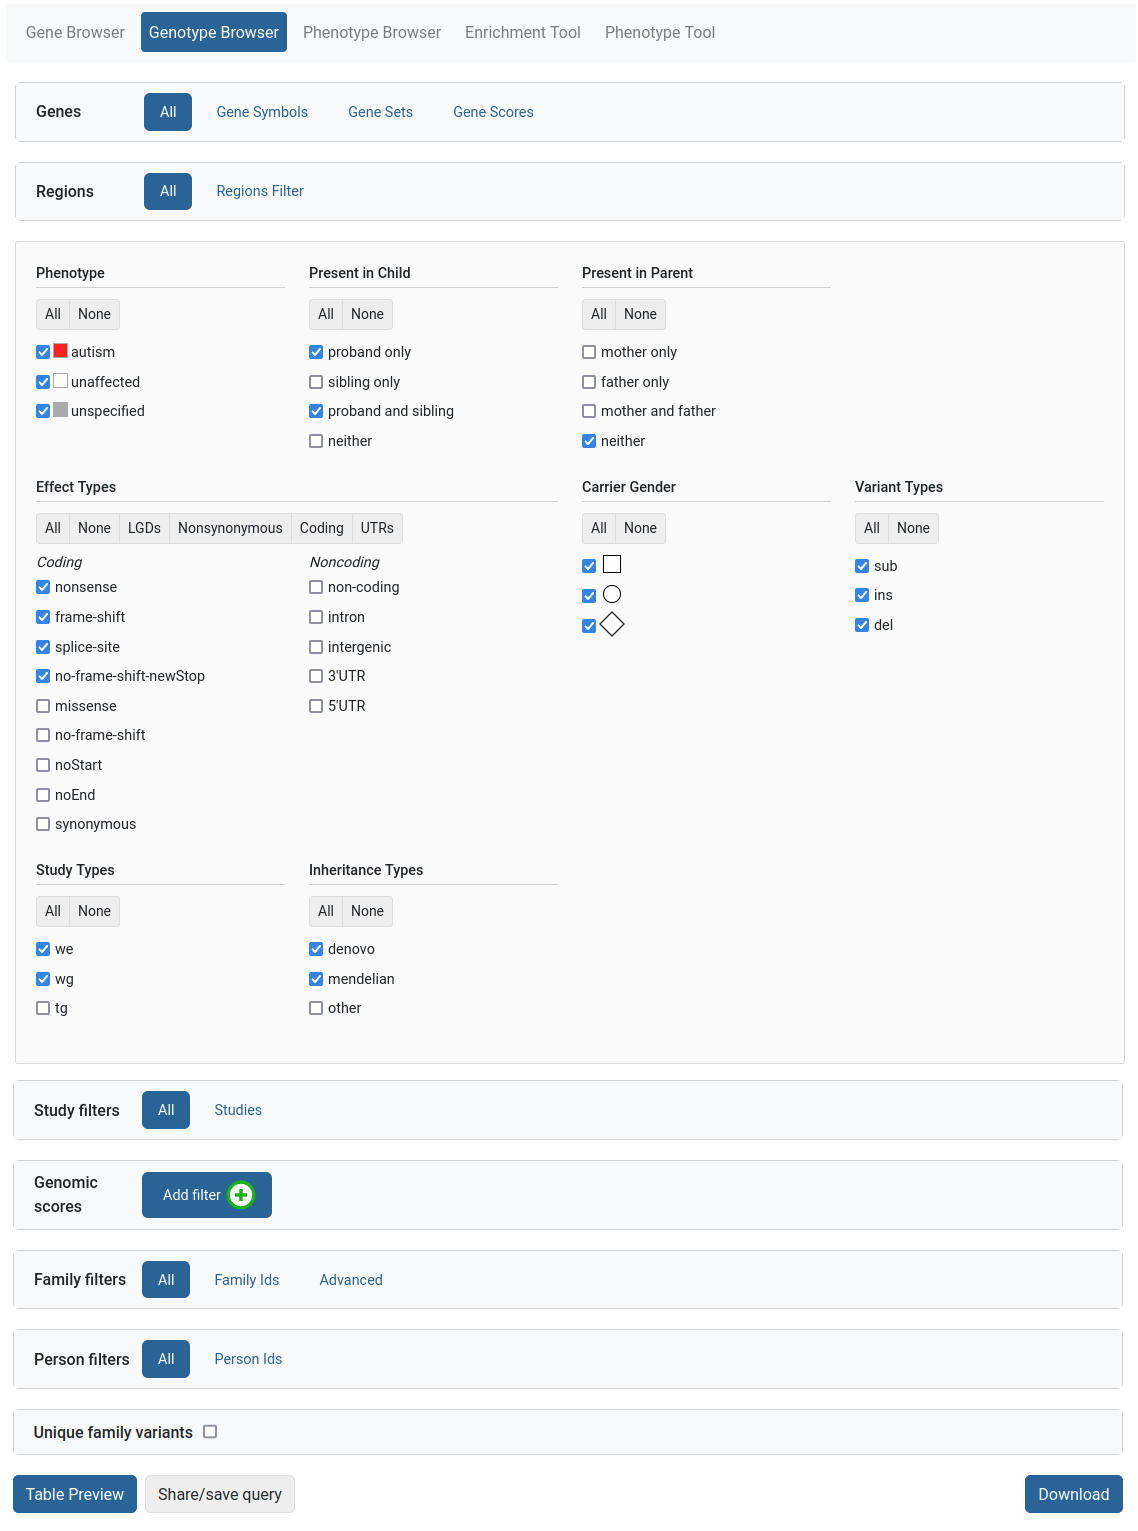
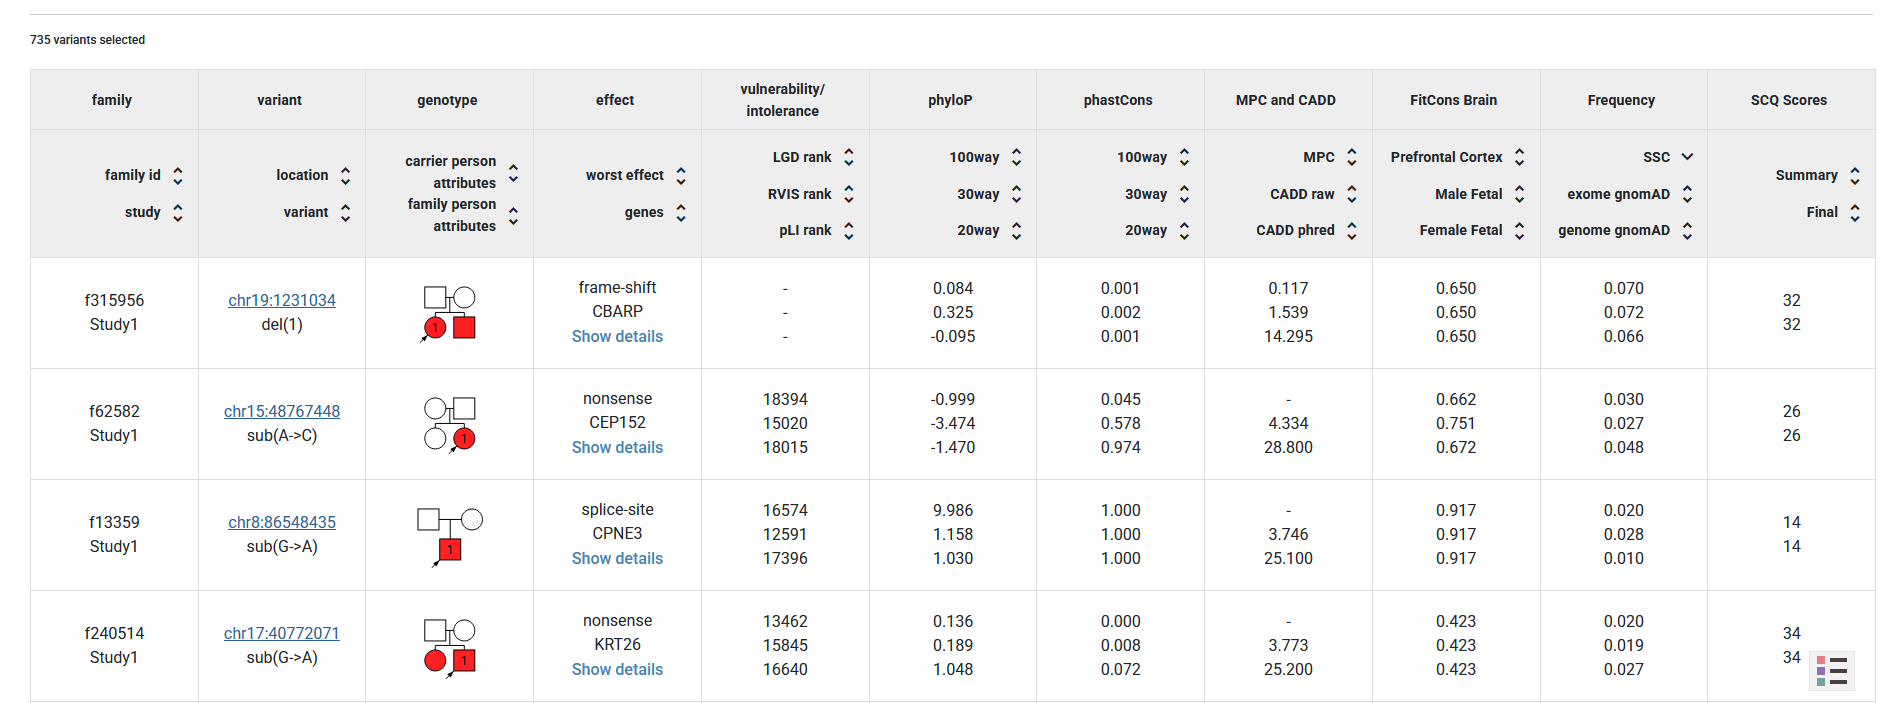
After the query is set up, the user can preview the variants of interest within the website or download them as an Excel file for further analysis.
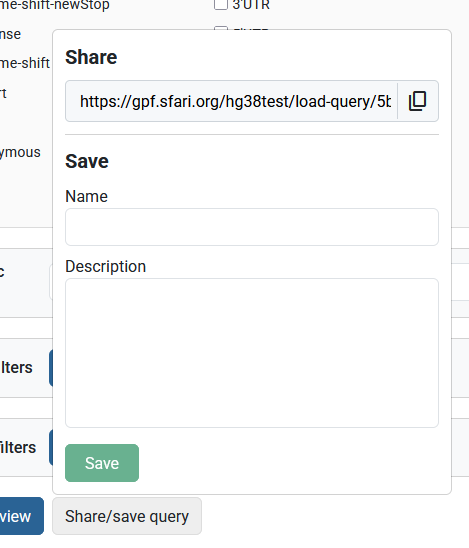
Queries can be shared via the “Save/share query” button or saved for future work.
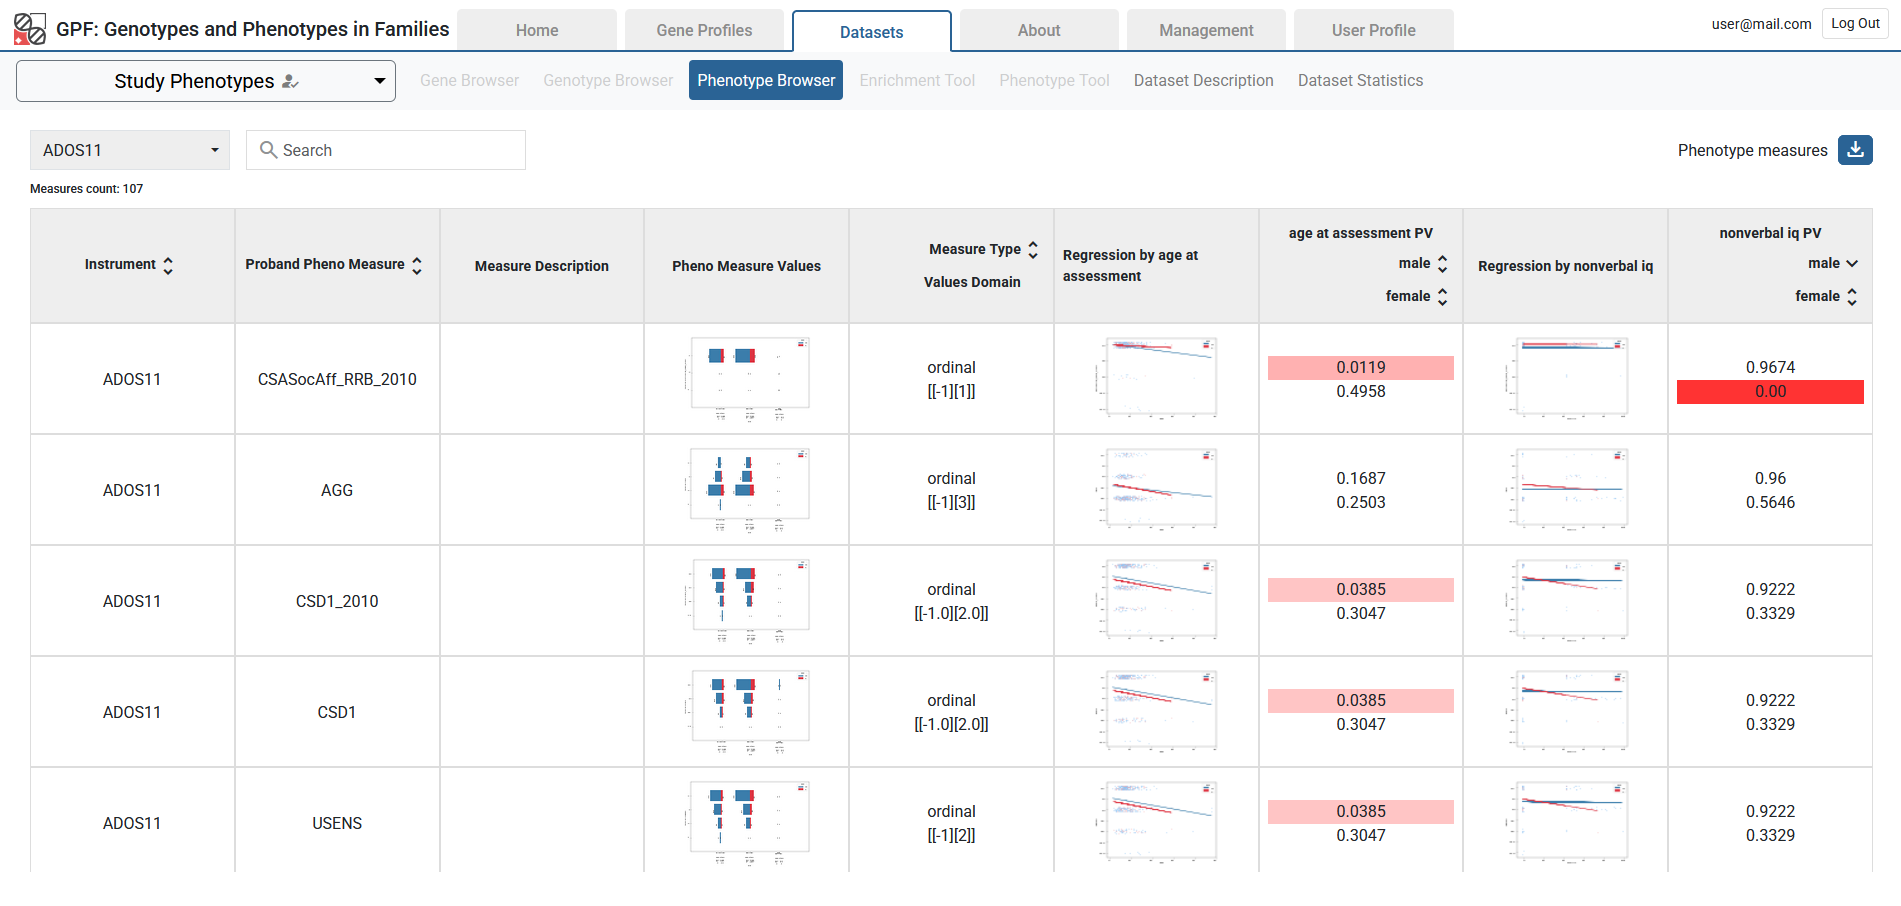
Phenotype Browser
The Phenotype Browser tool shows the phenotypic data associated with a data set. The data is organized by instruments applied to individuals, where each instrument has a set of measures. These measures are displayed in a table alongside their histograms across the individuals in the datasets (split by role and diagnosis). An instruments dropdown and a search are provided. The table can be downloaded as a spreadsheet file.
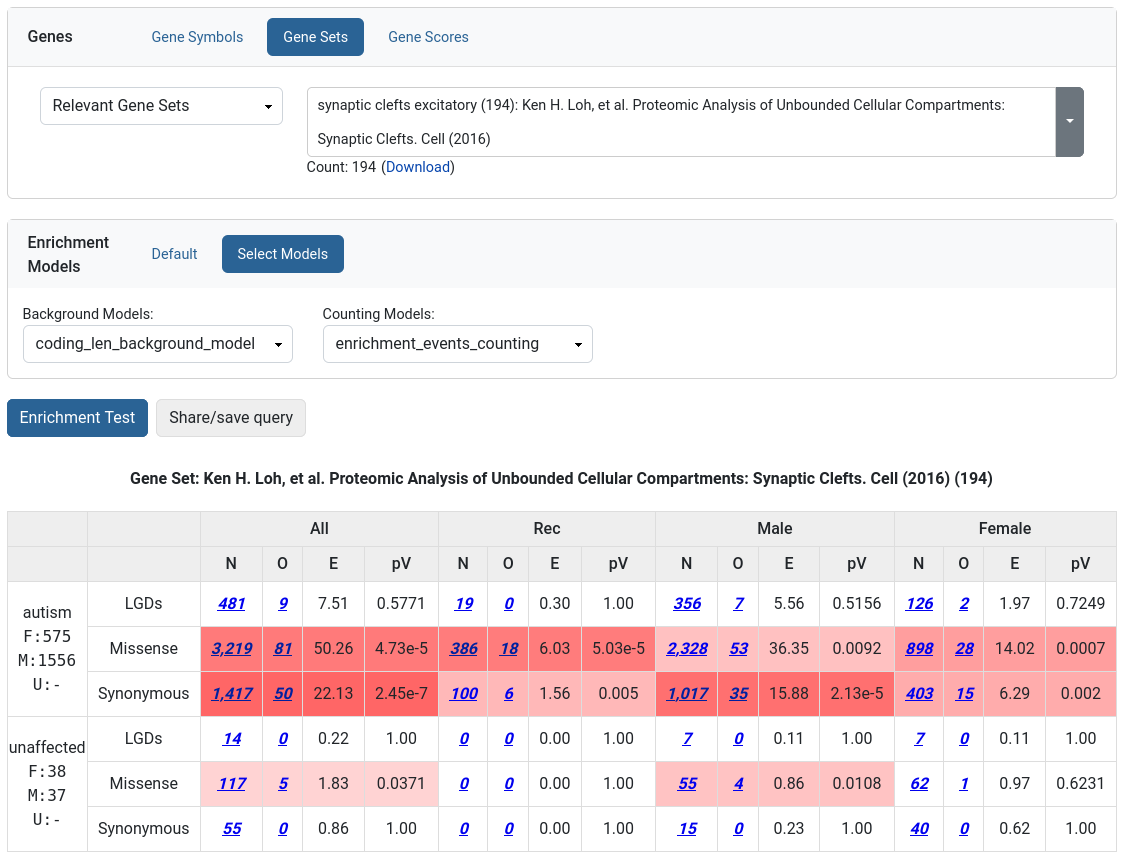
Enrichment Tool
The Enrichment Tool allows the user to test how strongly a given set of genes are affected by de novo mutations.
Such an approach has been used to demonstrate that there is functional convergence of de novo mutations in autism (i.e., damaging de novo mutations in children with autism target synaptic genes and genes encoding chromatin modifiers) and that the de novo mutation in autism targets similar genes as the de novo mutation in intellectual disability and epilepsy. The same technique was applied in studies of various other disorders. Moreover, users can use the Enrichment Tool to tests hypotheses driven by their own research against the large amount of genetic data managed by GPF. To use the tool, the user has to choose a gene or a set of genes to test. Enrichment models can be applies as additional normalization criteria.
Background models
Selecting an appropriate background model for the Enrichment Tools is crucial for the proper use of the tool and the accurate interpretation of its results. We strongly recommend that users verify the selection of a reasonable background model by using control experiments involving synonymous variants and/or unaffected individuals.
The enrichment tool supports two different classes of background models. The first class covers models that provide the expected number of de novo mutations per haplotype and generation for each gene. One such model, described in Samocha et al. Nat Genet, 2014, is the “Samocha’s enrichment background model.” At its core, this model uses the expected mutation rates per nucleotide, conditional on the surrounding nucleotide triplets, and aggregates these nucleotide rates over the body of the gene to compute the expected number of LGD, missense, and synonymous mutations. The Enrichment Tool then accumulates the gene-level expectation across the genes within the tested gene set to compute the expected number of mutations within the selected gene set. It calculates an enrichment p-value based on the expected and the observed number of mutations using a Poisson distribution. The data for the “Samocha’s enrichment background model” is conveniently wrapped up as a resource in our public GRR (enrichment/samocha_background) and can, thus, be easily configured as a background model in any GPF instance.
The second class of background models comprises models that utilize a normalization weight for each gene to calculate the proportion of variants of a given type that are expected to fall within the selected gene sets. These models then utilize a binomial distribution to calculate p-values based on the observed overlap and expected proportions. In the past, we have used various types of normalization weights, including those based on the coding length of genes Iossifov et al., Nature, 2014 and those based on the number of synonymous variants Iossifov et al., Neuron, 2012. The weights based on the number of variants can more accurately account for biases in the sequencing technology (i.e., exome capture of a particular design) when the analyzed dataset uses the same technology as the one used to build the background model. In our public GRR, we provide several gene weight resources for use in configuring the Enrichment Tool background models. For example, hg38/enrichment/coding_length_ref_gene_v20170601 is based on the coding gene length in refGene gene models, and hg38/enrichment/ur_synonymous_SFARI_SSC_WGS_CSHL includes the counts of the ultra-rare synonymous variants we identified through whole-genome sequencing in the ~5,000 parents from the Simons Simplex Collection.
The Enrichment Tool also enables users to select the object to be counted when measuring the enrichment of a specific gene set. Users can choose to count the number of genetic variants or the number of genes covered by these variants. In most cases, counting variants is the more appropriate approach. Still, in certain situations with strong regional biases in de novo rates, it may be more effective to count the number of genes. It is worth repeating that one should always verify the choice of specific enrichment model by using appropriate controls.
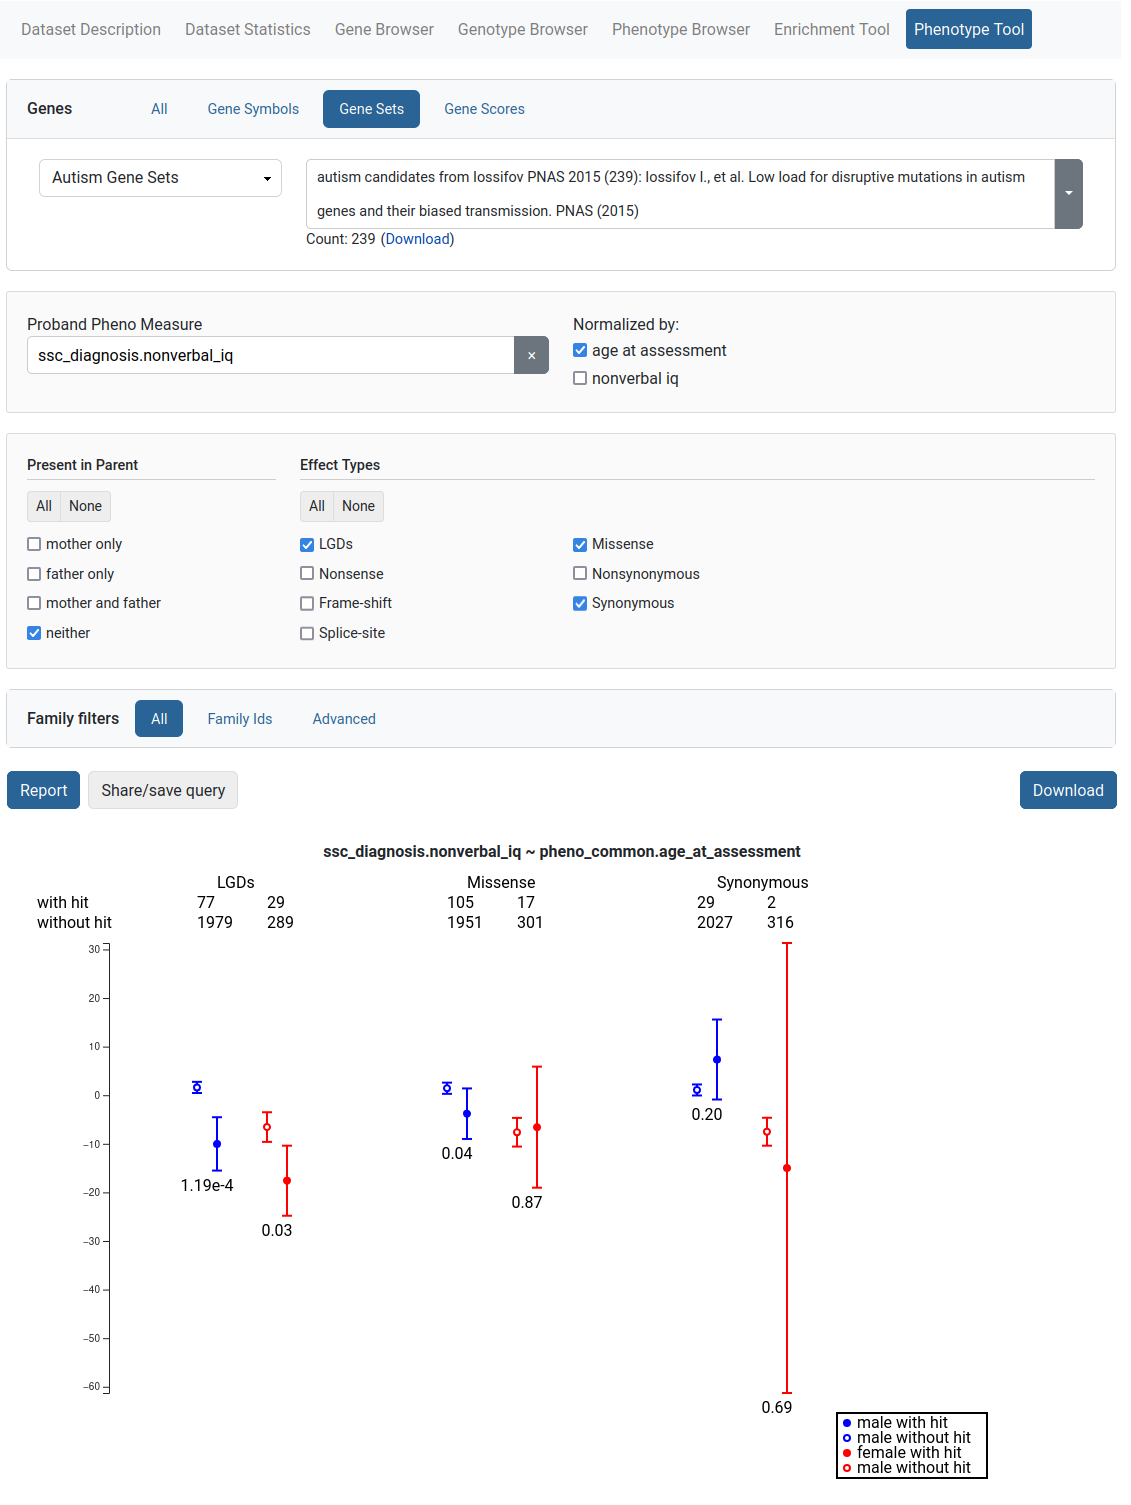
Phenotype Tool
The Phenotype Tool is used to study correlation of variants in gene sets and phenotype measures. To produce a report, the user selects a phenotype measure and optional measures to normalize by. Additional filters are also provided. The results are available for downloading.
Gene Profiles
The Gene Profiles tool can be used to view a table of statistics about genes in the configured datasets. The table is interactive - columns can be sorted, toggled and reordered.
Each gene symbol can be clicked to open the single view for that gene. Some of the columns represent a statistic for a dataset - their cells can be clicked to open the corresponding genotype browser query. Rows can be highlighted using the middle mouse button or CTRL / ⌘ + click. Highlighted genes are listed in the bottom right and can be opened for comparison (fig. 4).
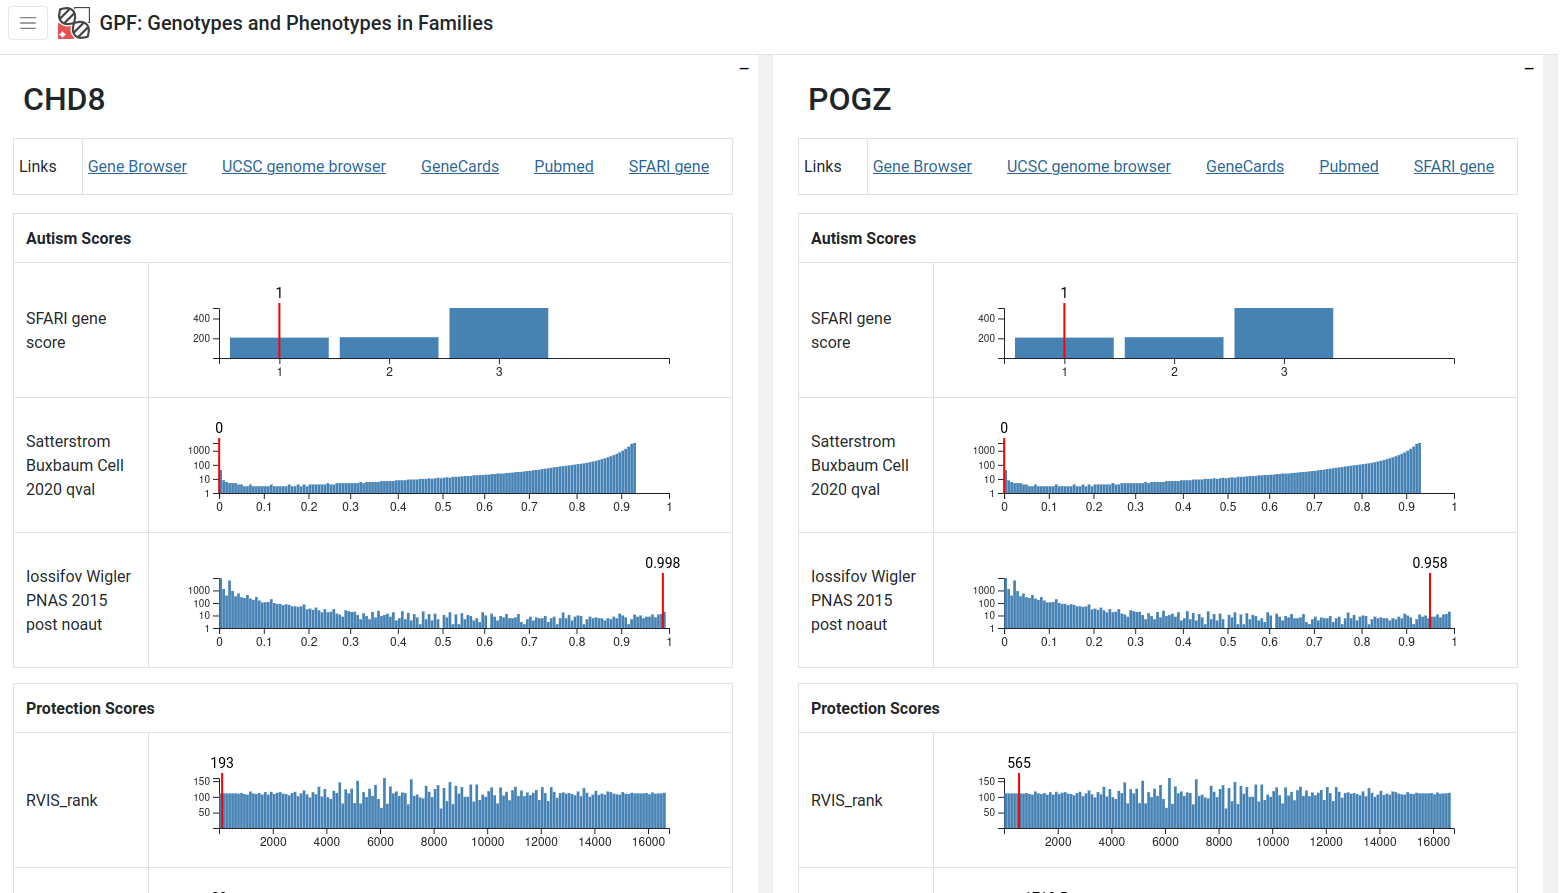
Figure 4
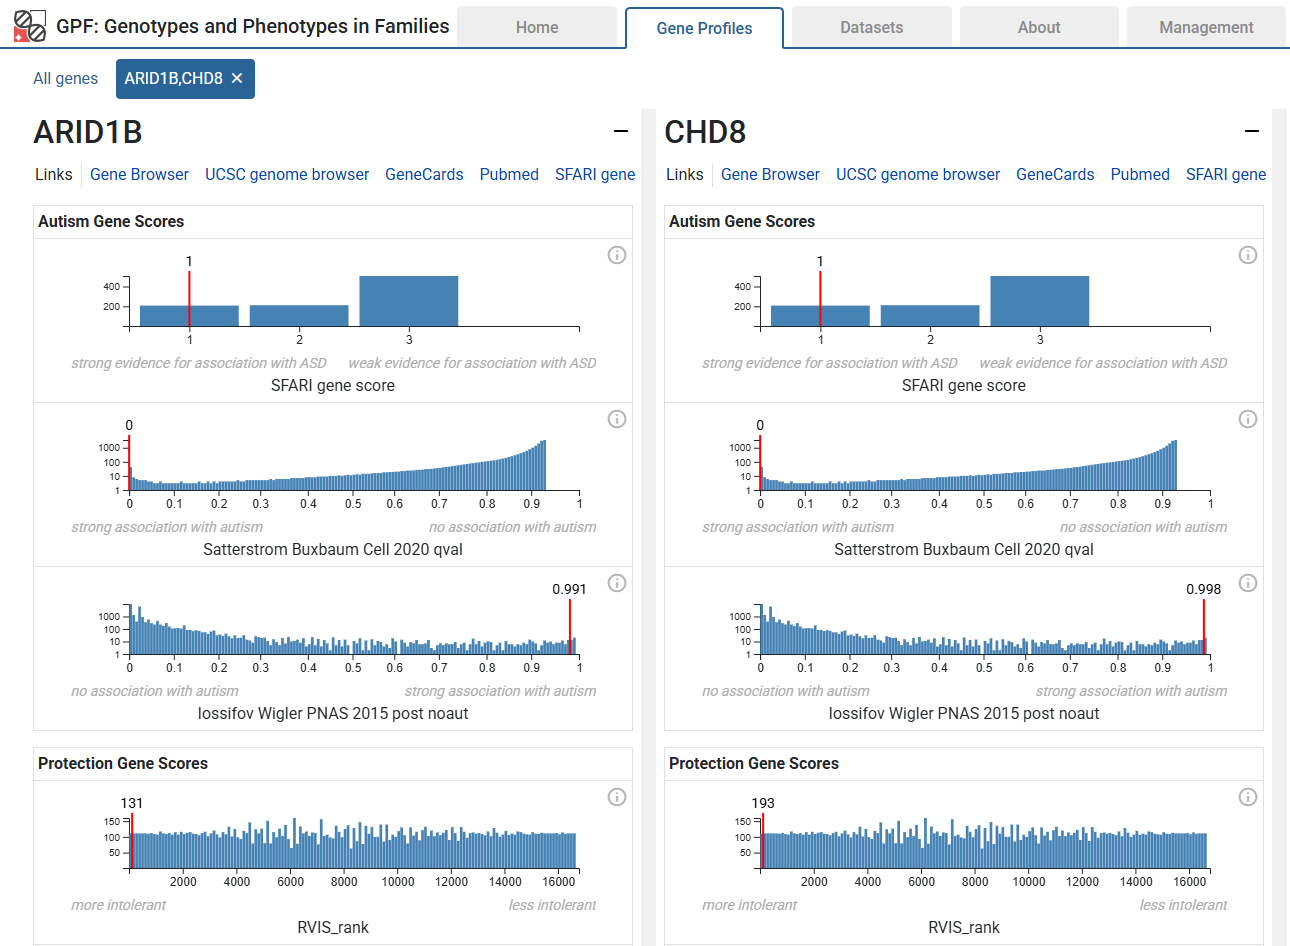
Gene Profiles - single view
The single view is a dedicated view for one or more genes. It contains the information you’d find in the table, but presented in more detail. For example, scores are presented in the context of the histogram for the whole range of score values. There are also useful links for external resources such as the UCSC Genome Browser.
Filters
Below is a list of the available filters in GPF.
General Filters
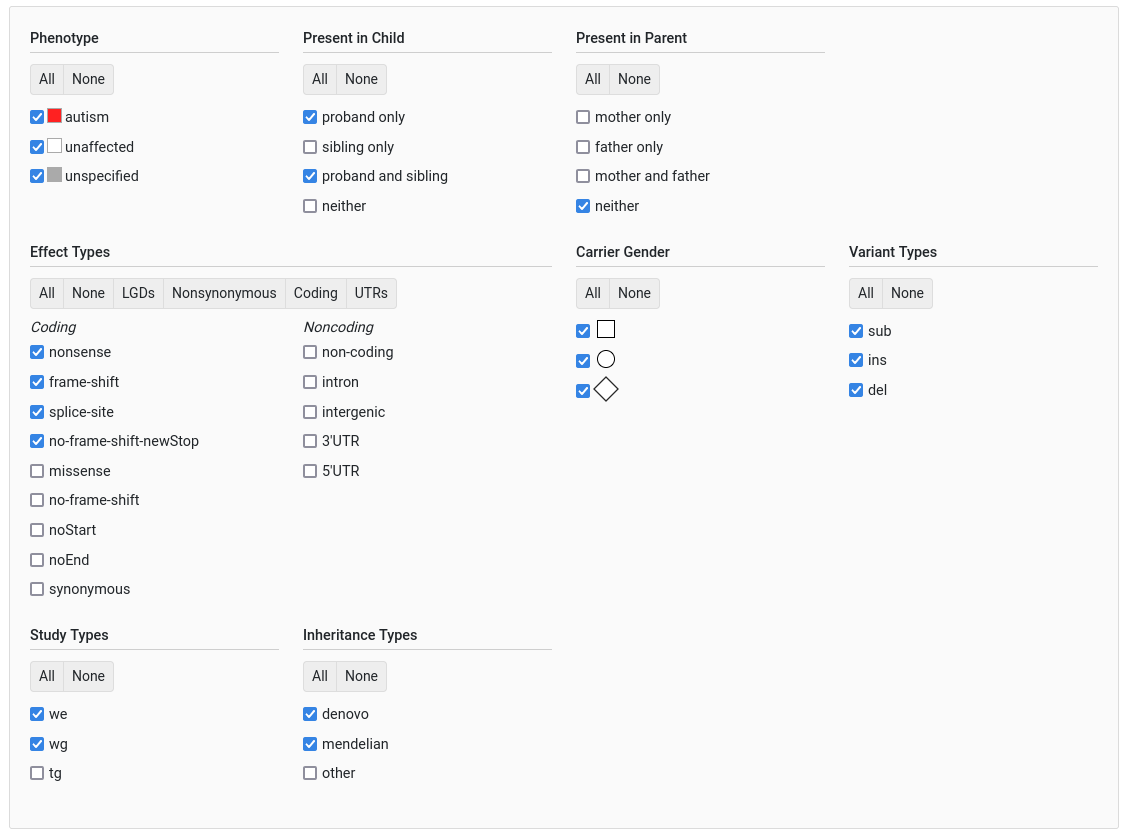
General filters
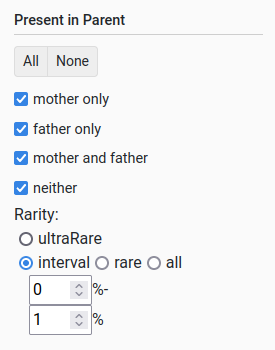
Present in parent
This filter allows querying whether the variant is found in a parent and the frequency with which it occurs. When choosing the frequency, the user can select:
All variants (via “all”)
Variants that occur less than X % (via “rare”)
Variants that occur between X and Y % (via “interval”)
Variants that occur in only a single individual (via “ultraRare”)
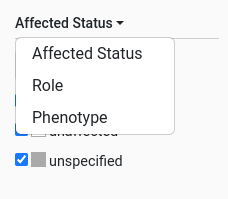
Pedigree selector
The pedigree selector has a dropdown to choose a criteria from:
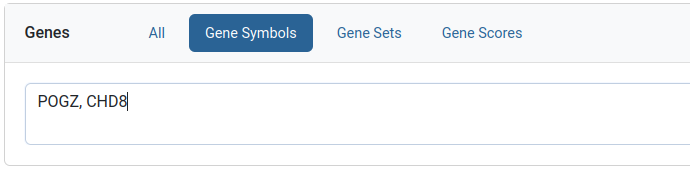
Gene symbols filter
Specific genes can be queried for using this filter. Gene symbols can be listed as comma or newline separated values.
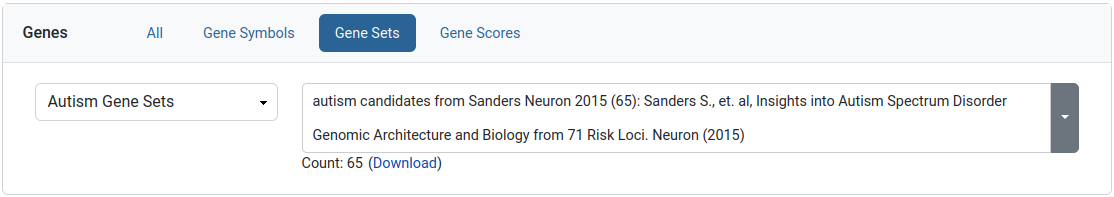
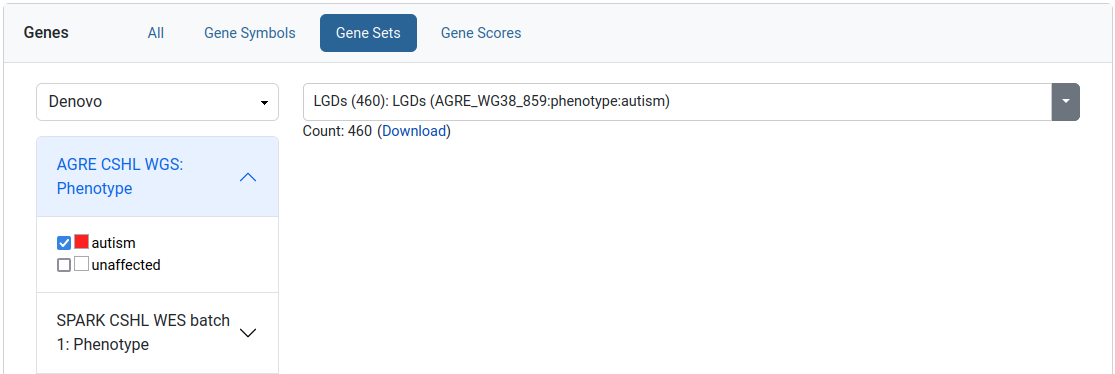
Gene sets filter
This filter allows the user to limit his query to a specific set of genes. We provide collections of published gene sets as well as sets based on de novo variants in our datasets. A download link is available for the selected gene set.
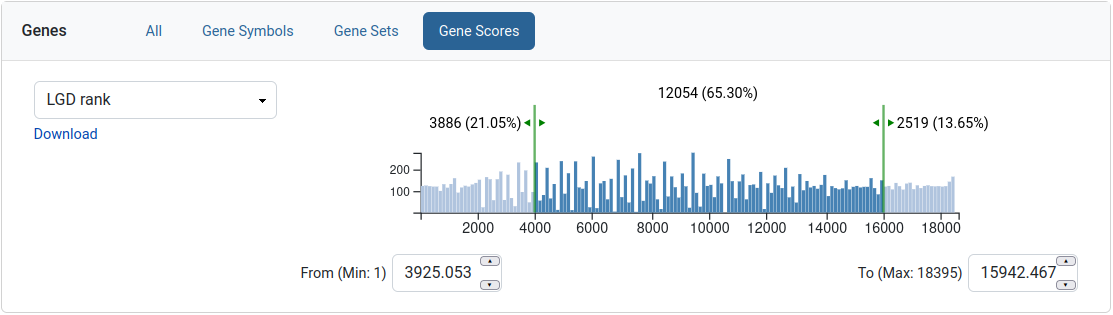
Gene scores
This filter allows the user to limit his query to a range of values for a given gene score. The gene score is presented as a histogram with two sliders which can be moved to select a range. The text next to the left and right sliders represents the amount of genes excluded from the selection. The text in the middle is the amount of genes that are selected. A download link is available for the gene scores.
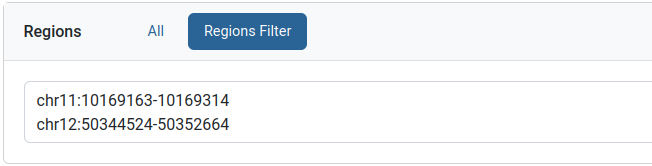
Regions filter
This filter can be used to limit the query to a specific genomic region. The format is a comma or a newline separate list of a region strings. Each region string follows a “CHR:POS” or “CHR:POS_BEG-POS_END” format.
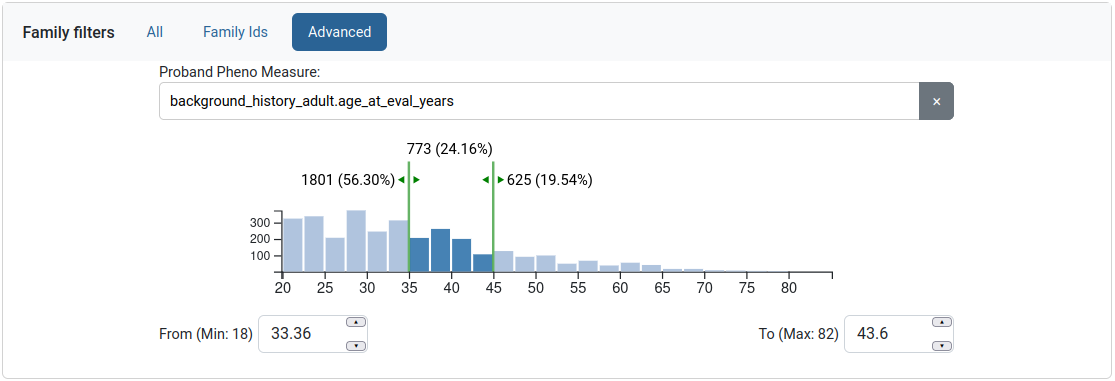
The user can also filter by phenotypic measures through the “Advanced” tab. A measure is selected and the user is provided with a histogram, similar to the Gene scores filter.
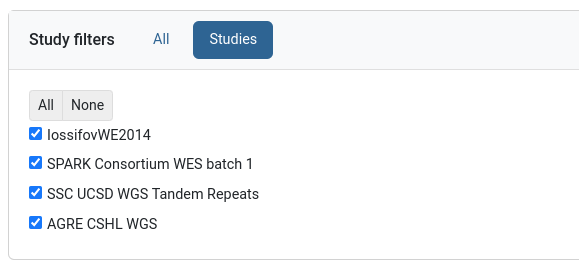
Study filters
This filter can be found on genotype data groups and allows selecting a subset of its studies.
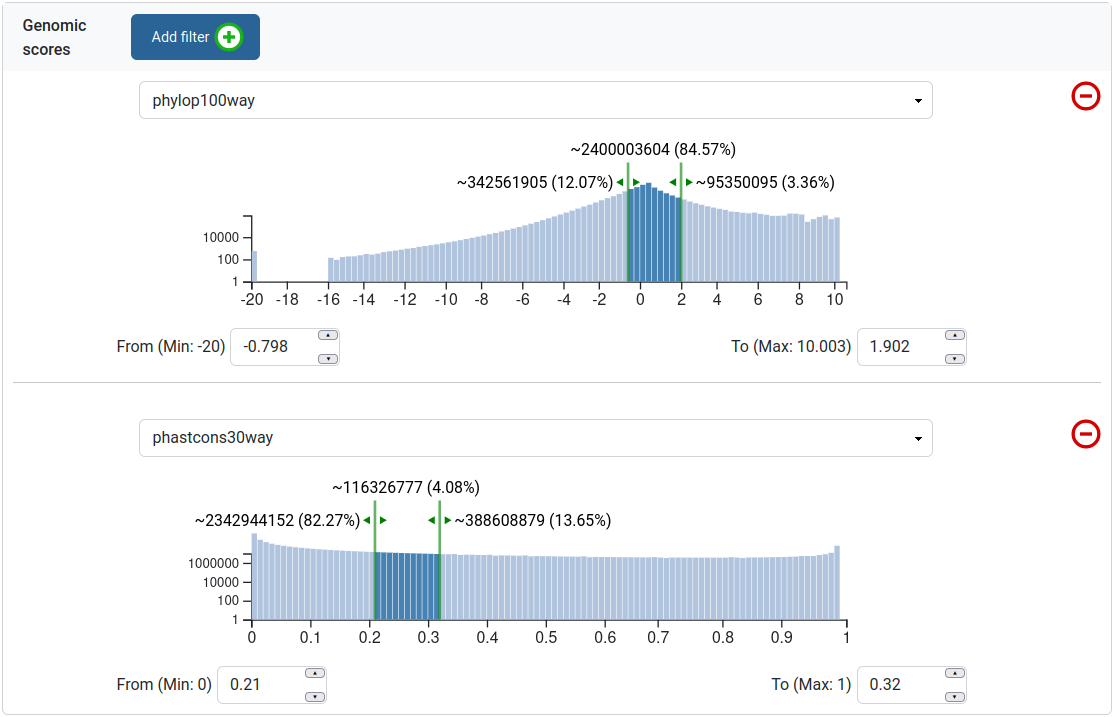
Genomic scores filters
This filter allows the user to limit his query to a range of values for a given genomic score, similar to the Gene scores filter. The user can filter by multiple genomic scores. This filter is dependent on variant annotation during genotype data import.
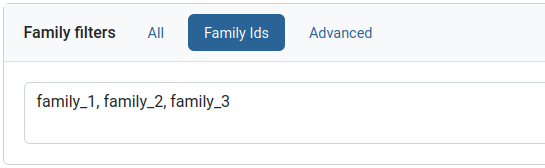
Family and person filters
These two filters have identical interfaces, but work on families or individuals respectively. Specific families or individuals can be queried for using the “IDs” tab. IDs can be listed as comma or newline separated values.
Unique family variants
This toggles how identical family variants from different studies are shown.

GPF User Management
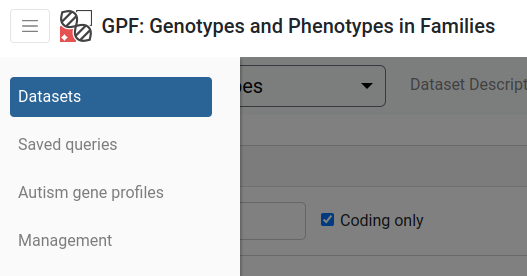
All options concerning User Management can only be found by admin users in the Management tab from the upper left corner menu
Open sidebar menu.
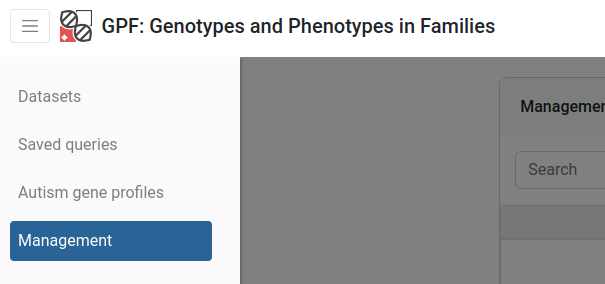
Open Management page.
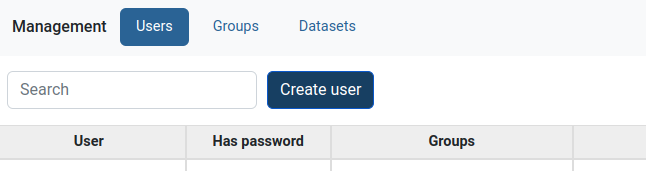
Interacting with users is achieved via the Users category in the Management tab from the menu. Every user is represented by a row on the table shown in the Users category.
How to create a new user?
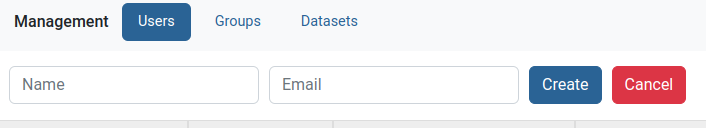
Above users management table click on Create user.
Enter name and email of the new user, then click Create.
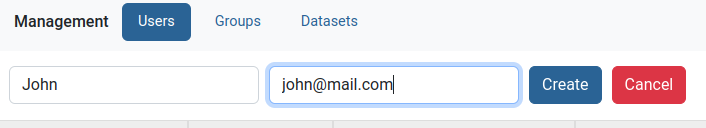
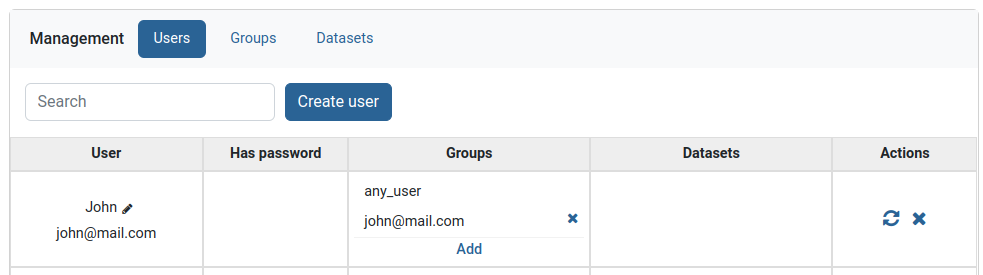
The new user will show on top of the users table ready to be edited further.
Note
To login with the new user a password must be set. This could be accomplished from:
The login interface by clicking on Forgotten password.
The Users Management table by clicking on a user’s Reset password button.
How to specify permissions for a given user?
Find the user then click on the Add button in the Groups column
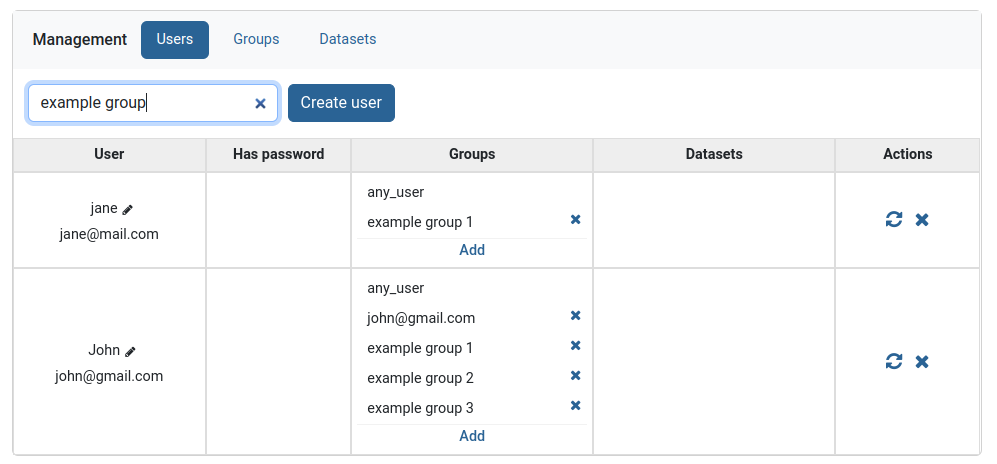
A small menu will appear, that lists all unadded groups. Search the group and click on it.
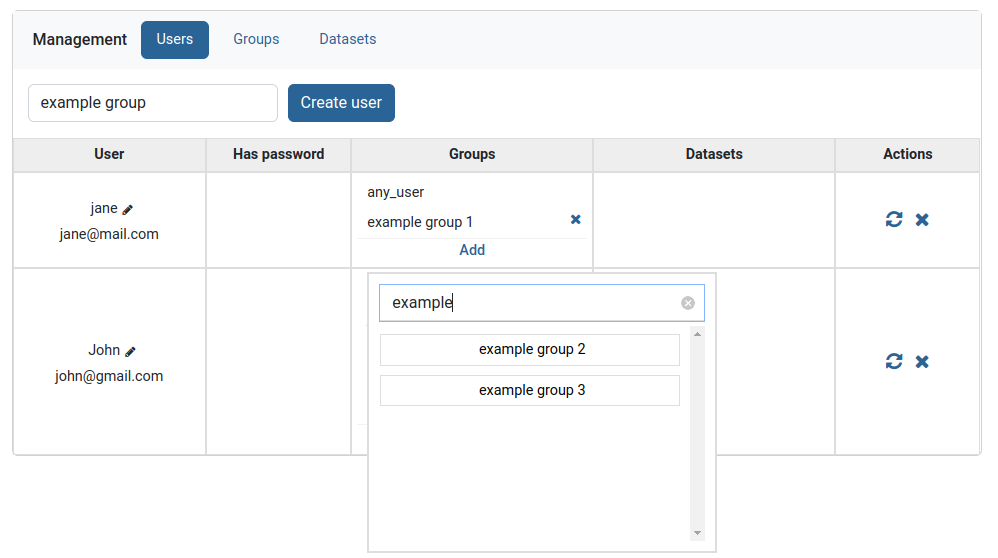
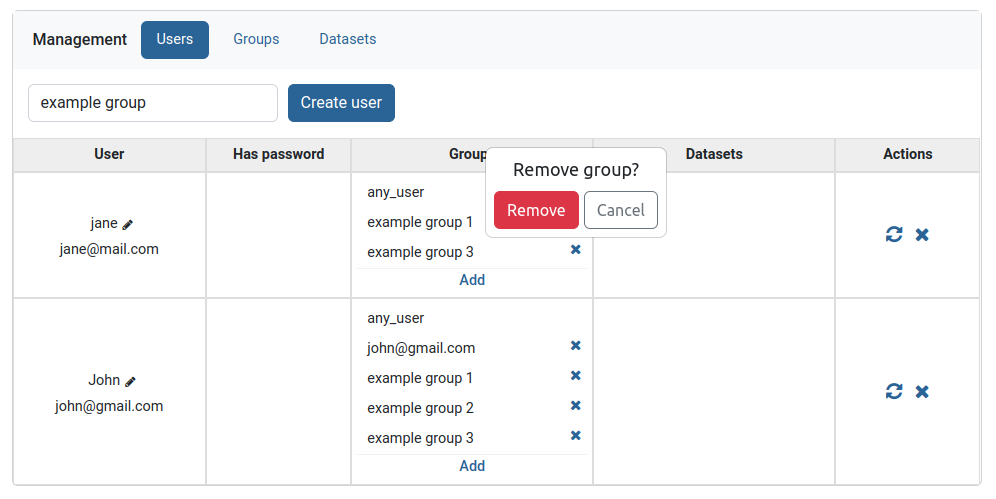
The group will now appear in the list of groups in the Groups column. To now remove it click on the small x button to the right of the group and then confirm removal.
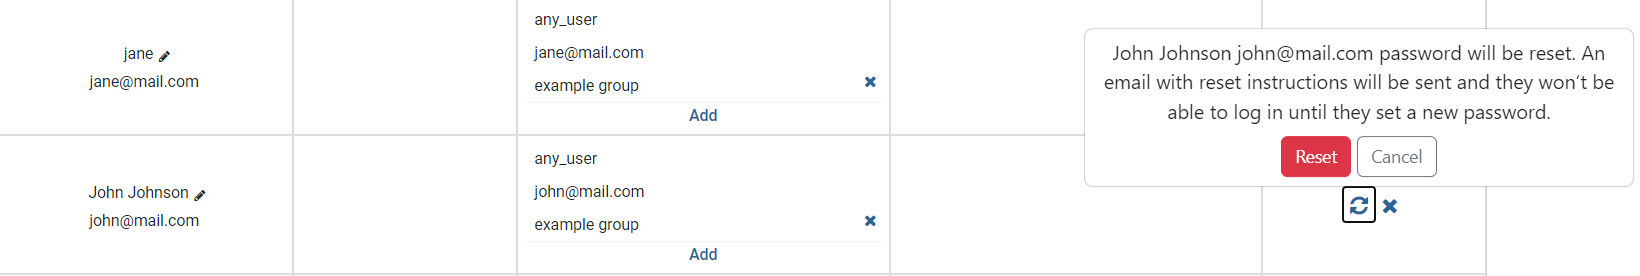
Reset password
Clicking on the left icon in the Actions column, resets the password of the user shown on the current row. This button will send the user in question an email with a corresponding link, obligating them to choose a new password for their account.
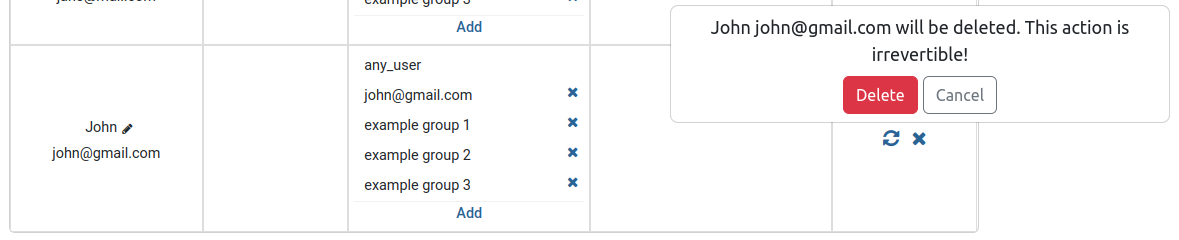
Delete user
Clicking on the utmost right X button in the Actions column, deletes the user shown on the current row.
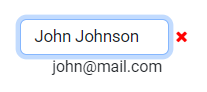
Edit user name
Clicking on the pencil icon in the User column, allows editing the name of the user shown on the current row.

Input field will show showing the current user name.
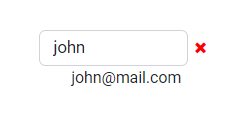
Change it to something else (cannot use empty names or names that are too short) and press enter.
Groups are entities that associate users with datasets. If a user wishes to access a certain dataset, he has to belong to a group containing that dataset. Users and datasets can be in multiple groups simultaneously. The easiest way to add multiple users and datasets to a group is through the groups table view.
When a new user or dataset is created, they are automatically assigned to groups with their corresponding names.
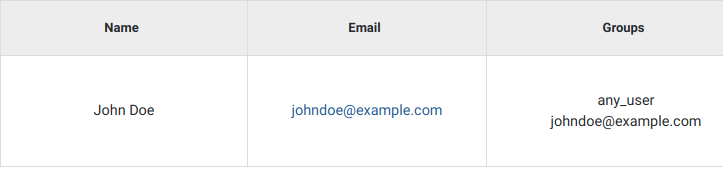
Example of newly added user
Special Groups
Users assigned to the admin group, have all permissions. Only admin users can view or interact with other users, groups or datasets.
anonymous@seqpipe.org is a group that all unregistered users belong to. They lack permissions for accessing most of the datasets. Inaccessible datasets are shown in grey color.
Example of a dataset accessible to all users
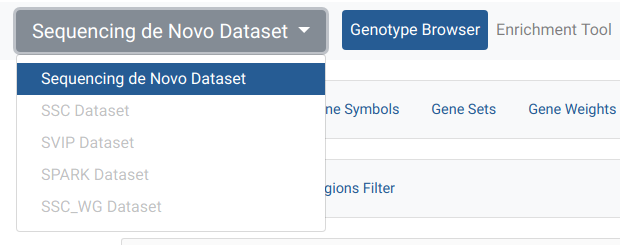
Datasets could belong to a group called hidden. This group indicates which datasets should stay hidden (instead of showing them in grey color) in the dropdown menu on the dataset page for users without access permissions.
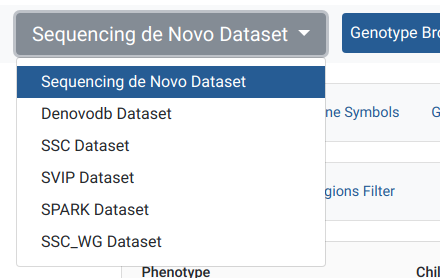
Example of a hidden dataset, visible after user is logged in
In this case, Denovo DB Dataset is an option for the registered user, as opposed to when an anonymous user is opening the menu in the previous example.
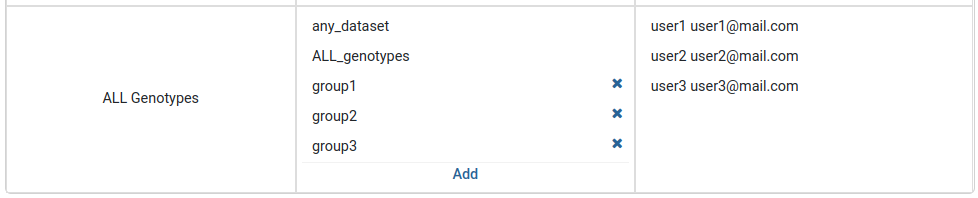
Certain datasets are visible to every registered user. They belong to the any_user group which is automatically assigned to every account and cannot be removed.
any_dataset is a group that contains all of the available datasets. Admins are usually subscribed to this group.
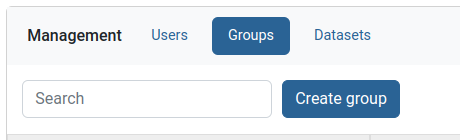
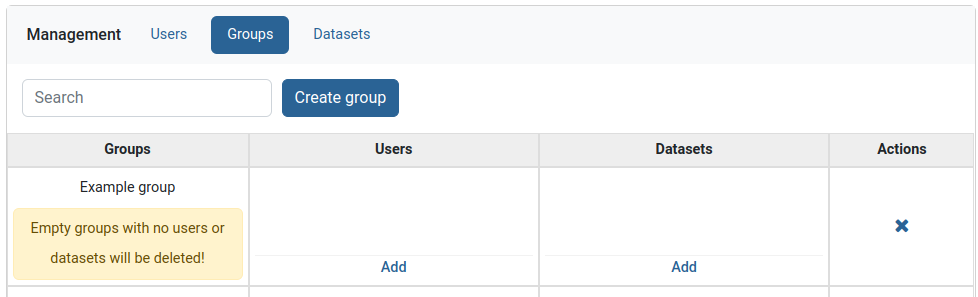
Creating group
In the Groups tab on the Management menu, above groups management table click on Create group.
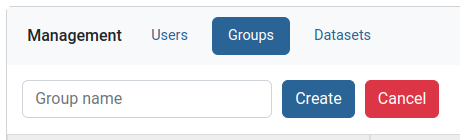
Type the new group name and press create.
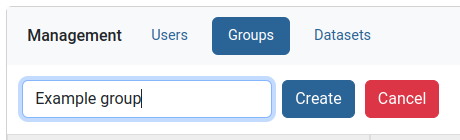
To finish group creation you need to add at least one user or one dataset to the group, because empty groups cannot exist.
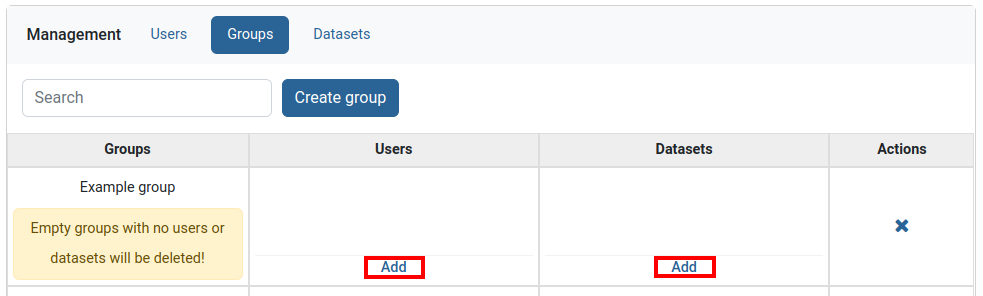
Adding users and dataset to group
Find the group you want to edit then add users and datasets through the Add buttons in users and datasets columns.
In the Datasets tab on the Management menu, admins can observe information about which users have access to a dataset or which groups does a dataset belong to. The easiest way to add a dataset to multiple groups is through the Datasets table view.
Adding group to a dataset
Find the dataset you want to edit then add groups through the Add button in group column.