Getting started with GRR
Create your first GRR
To create a new Genomic Resource Repository (GRR), start by making an empty directory and moving into it:
mkdir my_GRR
cd my_GRR
Initialize this directory as a GRR:
grr_manage repo-init
From now on, any subdirectory under my_GRR becomes a genomic resource if:
It contains a properly configured
genomic_resource.yaml, andIt includes the data files referenced in that YAML.
Connect the local GRR to GAIn
A fresh GAIn installation includes access to the default public IossifovLab GRR. To make GAIn use my_GRR for browsing and annotation, add it to your GRR definition file, ~/.grr_definition.yaml. Replace <path_to_my_GRR>/my_GRR with the full path to the my_GRR directory you created above.
id: development
type: group
children:

- id: main-GRR
  type: url
  url: https://grr.iossifovlab.com

- id: my_GRR
  type: directory
  directory: <path_to_my_GRR>/my_GRR
This configuration tells GAIn that, when resolving a resource ID, it should first look in the public GRR
hosted by the Iossifov lab (GRR). If the resource is not found there, it then falls back to the local
directory-based GRR (my_GRR).
You can confirm that GAIn recognizes both GRRs by running grr_browse:
grr_browse
The output should show that GAIn is using ~/.grr_definition.yaml and that
both main-GRR and my_GRR are included in the active GRR definition:
Working with GRR definition: <home directory>/.grr_definition.yaml
id: development
type: group
children:
- id: main-GRR
  type: url
  url: https://grr.iossifovlab.com
- id: my_GRR
  type: directory
  directory: <path_to_my_GRR>/my_GRR

samocha_enrichment_background 0        4 1.38 MB      main-GRR enrichment/samocha_background
gene_score           0        6 7.8 MB       main-GRR gene_properties/gene_scores/Iossifov_Wigler_PNAS_2015
gene_score           0       11 576.07 KB    main-GRR gene_properties/gene_scores/LGD
...
Add new resources to the local GRR
1: Toy genome
Reference genomes live in FASTA files, and the human reference FASTA is on the order of gigabytes (~3 Gb),
which makes it inconvenient as a first example. Instead of starting with the full human genome, we will use
a toy genome made of two very short chromosomes (10 bases each). A genome resource in GAIn always has two components:
the FASTA file that holds the sequences and a .fai index file that enables fast random access.
From within your my_GRR directory, create a directory called my_minigenome and move into it.
mkdir my_minigenome
cd my_minigenome
Create a new text file with the content below and save it as minigenome.fa.
>chr1 1st_chromosome
TATGAAATAA
>chr2 2nd_chromosome
AAAAAAAAAA
Before GAIn can efficiently access a genome, the reference FASTA must be indexed to enable fast random access. We use samtools for this step. If it is not already available in your environment, install it with:
mamba install -c bioconda -c conda-forge samtools
Run the following command to index minigenome.fa. This generates a FASTA index file (.fai) that GAIn uses as a
lookup table:
samtools faidx minigenome.fa
Next, create a file named genomic_resource.yaml with the following content;
this configures the minigenome resource so GAIn can recognize and use it for annotation:
type: genome
filename: minigenome.fa
chrom_prefix: "chr"
meta:
  summary: mini genome
With the FASTA, index, and genomic_resource.yaml in place, the my_minigenome resource is already usable for
annotation by GAIn.
We strongly recommend running the command below, which checks the resource and produces summary statistics.
grr_manage resource-repair
On successful completion, an index.html file will appear in the my_minigenome directory.
It contains basic metadata about the resource, statistics such as chromosome length and
nucleotide/dinucleotide composition, and a full inventory of the files that make up the resource.
Note
resource-repair does not update the repository-wide index —
the .CONTENTS files and the repository’s index.html. Those
are published separately by grr_manage repo-index, run from
the repository root. Do that once you want the repository as a
whole (rather than the single resource) to reflect your changes.
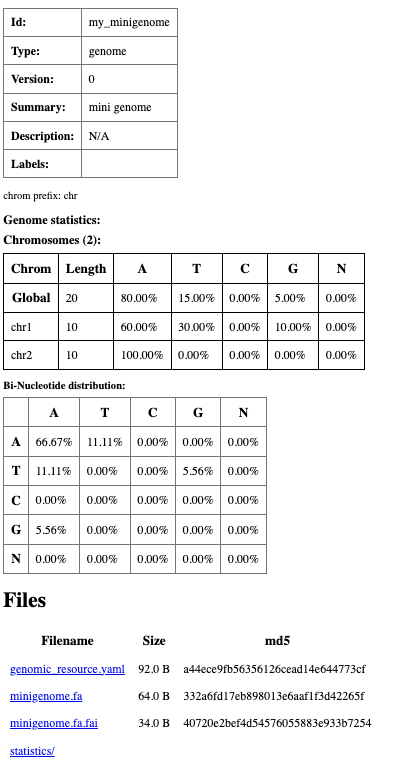
Summary html page created for my_minigenome resource.
2: Genome (GRCh38.p14)
Next, we configure a real human genome resource. From inside my_GRR, make a directory named my_genome and change
into it:
mkdir my_genome
cd my_genome
Then fetch the GRCh38.p14 genome FASTA from the GENCODE FTP site:
curl -o GRCh38.p14.genome.fa.gz \
https://ftp.ebi.ac.uk/pub/databases/gencode/Gencode_human/release_46/GRCh38.p14.genome.fa.gz
GAIn can use BGZF-compressed FASTA files directly. The downloaded file is gzip-compressed, so first decompress it and then recompress it using bgzip, which produces a compressed FASTA that can be indexed by samtools.
Use the following commands in the my_genome directory to recompress and index the FASTA file:
gunzip GRCh38.p14.genome.fa.gz
bgzip GRCh38.p14.genome.fa
samtools faidx GRCh38.p14.genome.fa.gz
You now have the BGZF-compressed FASTA file and its .fai index. Add a genomic_resource.yaml file in this directory with the content below. Here, filename specifies the compressed FASTA file used for the genome sequence, chrom_prefix indicates that chromosome names in this assembly use the chr prefix, for example chr1, and PARS lists the pseudoautosomal regions on chromosomes X and Y.
type: genome
filename: GRCh38.p14.genome.fa.gz
chrom_prefix: "chr"

PARS:
  "X":
    - "chrX:10000-2781479"
    - "chrX:155701382-156030895"
  "Y":
    - "chrY:10000-2781479"
    - "chrY:56887902-57217415"

meta:
  summary: Nucleotide sequence of the GRCh38.p14 genome assembly
At this point, the my_genome resource can be used for annotation by GAIn.
To validate it and obtain summary statistics, run grr_manage resource-repair in this directory.
Be aware that this step can be slow (~5 minutes), as it processes the entire genome to build the report.
On successful completion, an index.html file will appear in the my_genome directory,
which contains basic metadata about the resource, statistics such as chromosome length and nucleotide/dinucleotide
composition, and a full inventory of the files that make up the resource.
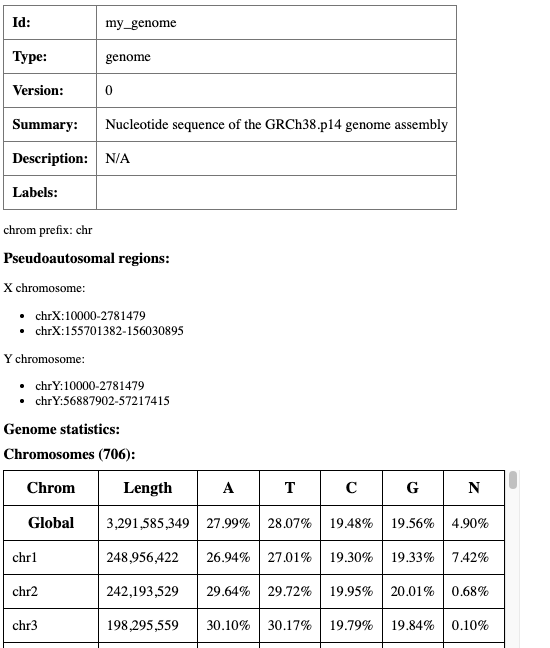
Partial display of summary html page created for my_genome resource (partially displayed).
3: Gene models (MANE v1.4)
Next, we will create a gene model resource based on the MANE (Matched Annotation from NCBI and EBI) gene set, which offers a standardized transcript set for consistent use across genomic resources.
From inside my_GRR, create a directory named my_genemodel and change into it:
mkdir my_genemodel
cd my_genemodel
First, we download the corresponding GTF file.
curl -O https://ftp.ncbi.nlm.nih.gov/refseq/MANE/MANE_human/release_1.4/MANE.GRCh38.v1.4.ensembl_genomic.gtf.gz
Next, create a genomic_resource.yaml file in the my_genemodel directory with the following content:
type: gene_models

filename: MANE.GRCh38.v1.4.ensembl_genomic.gtf.gz
format: gtf

meta:
  summary: MANE gene model version 1.4
With these files in place, my_genemodel is usable as a gene-model resource in GAIn.
To check it and produce an HTML summary with basic statistics, execute grr_manage resource-repair in this directory.
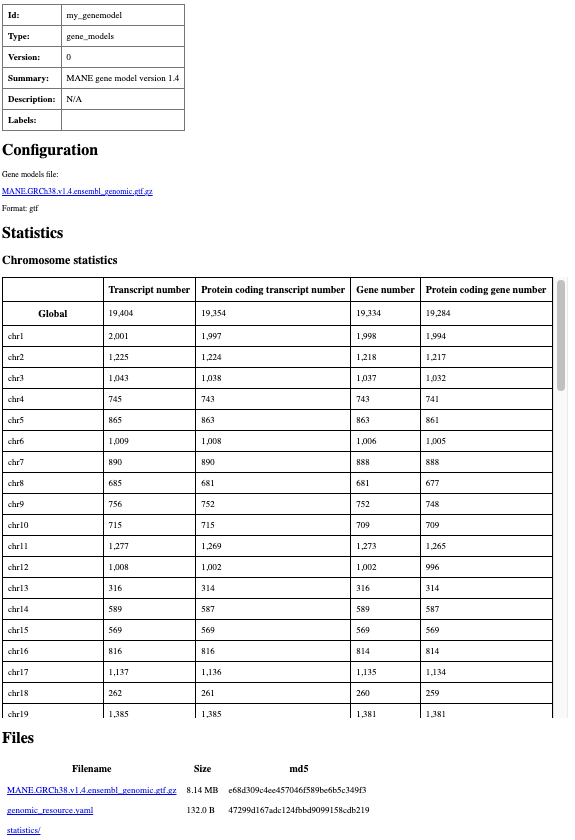
Partial display for summary html page created for my_genemodel resource.
4: Toy position score
In this example, we will create a toy position score resource which only has scores for a few positions
in chromosome 1. In your my_GRR directory, create a directory called my_miniposition:
mkdir my_miniposition
cd my_miniposition
Run the following command to create a tab-separated file called mini_positionscore.tsv. The file has three columns: the first column is the chromosome name, the second column is the 0-based position, and the third column is the score value.
cat <<'EOF' | awk 'BEGIN{OFS="\t"} {print $1,$2,$3}' > mini_positionscore.tsv
chr1        0       0
chr1        1       0.1
chr1        2       0.2
chr1        3       0.3
chr1        4       0.4
EOF
Next, create a genomic_resource.yaml file in the my_miniposition directory with the following content:
type: position_score

table:
  filename: mini_positionscore.tsv
  zero_based: True
  chrom:
    index: 0
  pos_begin:
    index: 1
  pos_end:
    index: 1

scores:
- id: pos_tsv_0
  type: float
  index: 2

meta:
  summary: 0-based tsv position score
The resource is ready for use by GAIn. To check it and produce an HTML summary with basic statistics,
execute grr_manage resource-repair in this directory.
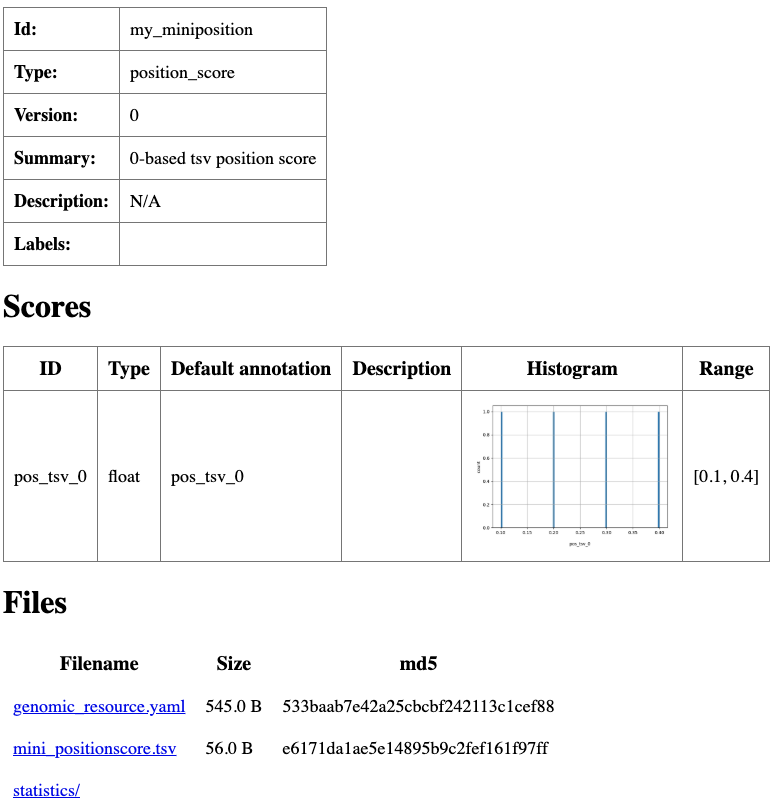
Summary html page created for my_miniposition resource.
5: Position score (PhyloP7)
Let’s now create a real position score resource. In your my_GRR directory, create a directory called my_position:
mkdir my_position
cd my_position
phyloP (phylogenetic P-values) scores measure the evolutionary rate at individual nucleotides or other genomic elements. Let’s download PhyloP7, which is derived from a multiple sequence alignment of the genomes of 7 different species (this is a large file around 5Gb, make sure you have enough space on your local drive).
curl -O https://hgdownload.soe.ucsc.edu/goldenPath/hg38/phyloP7way/hg38.phyloP7way.bw
Next, create a genomic_resource.yaml file in the my_miniposition directory with the following content:
type: position_score

table:
  filename: hg38.phyloP7way.bw

scores:
- id: phyloP7way
  type: float

meta:
  summary: Conservation score based on the multiple alignment of 7 species
The resource is ready for use by GAIn. To check it and produce an HTML summary with basic statistics,
execute grr_manage resource-repair in this directory (this will take around 30 minutes as GAIn processes the
large file to create summary statistics).
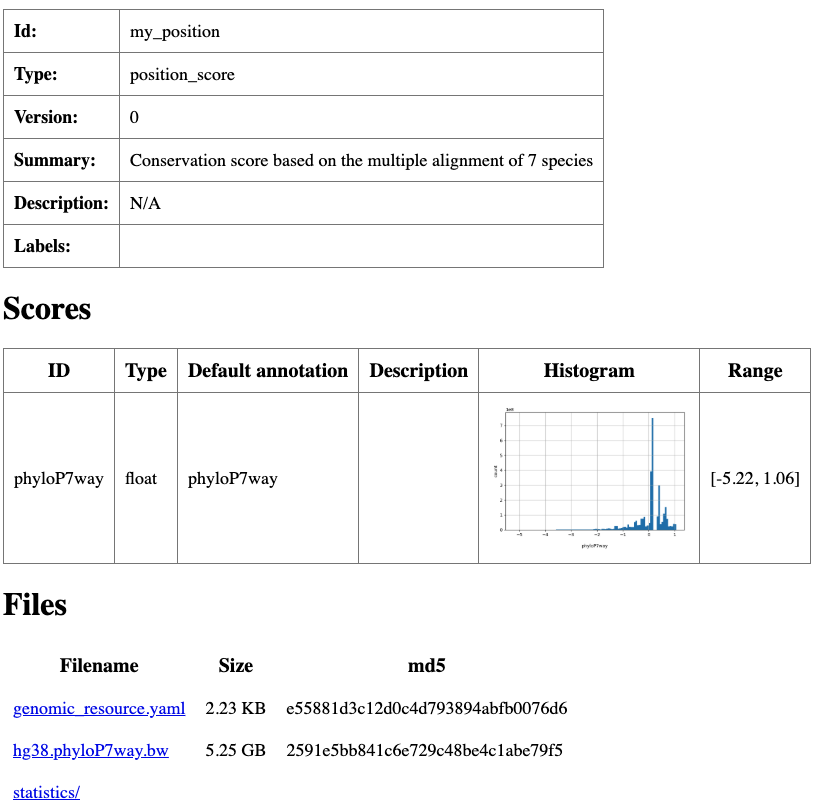
Summary html page created for my_position resource.
6: Toy allele score
Next, let’s create a toy allele score resource. In my_GRR, create a new directory called my_miniallele and move into it:
mkdir my_miniallele
cd my_miniallele
Run the following command to create a tab-separated allele score file called mini_allelescore.tsv. The file has six columns: chromosome name, 0-based position, reference allele, alternate allele, a numerical allele score, and an allele class represented by strings.
cat <<'EOF' | awk 'BEGIN{OFS="\t"} {print $1,$2,$3,$4,$5,$6}' > mini_allelescore.tsv
#chrom      pos     ref     alt     allele_score    allele_class
chr1        0       T       A       1       good
chr1        0       T       C       1.1     bad
chr1        0       T       G       1.2     bad
chr2        4       A       T       2       good
chr2        4       A       C       2.1     bad
chr2        4       A       G       2.2     bad
EOF
To prepare this allele score file for fast random access in GAIn, first compress and index it with:
bgzip mini_allelescore.tsv
tabix -s 1 -b 2 -e 2 -0 mini_allelescore.tsv.gz
Then create a genomic_resource.yaml file as shown. This file marks the resource as indexed, identifies which columns hold the chromosome,
position, reference, and alternate alleles, and describes the score columns that GAIn can use during annotation.
type: allele_score

table:
  filename: mini_allelescore.tsv.gz
  format: tabix
  zero_based: True

  chrom:
    name: chrom
  pos_begin:
    name: pos
  pos_end:
    name: pos
  reference:
    name: ref
  alternative:
    name: alt

scores:
- id: allele_score
  name: allele_score
  type: float

- id: allele_class
  name: allele_class
  type: str

meta:
  summary: A toy allele score resource with allele scores and allele classes.
The resource is ready for use by GAIn. To check it and produce an HTML summary with basic statistics, execute grr_manage resource-repair in this directory.
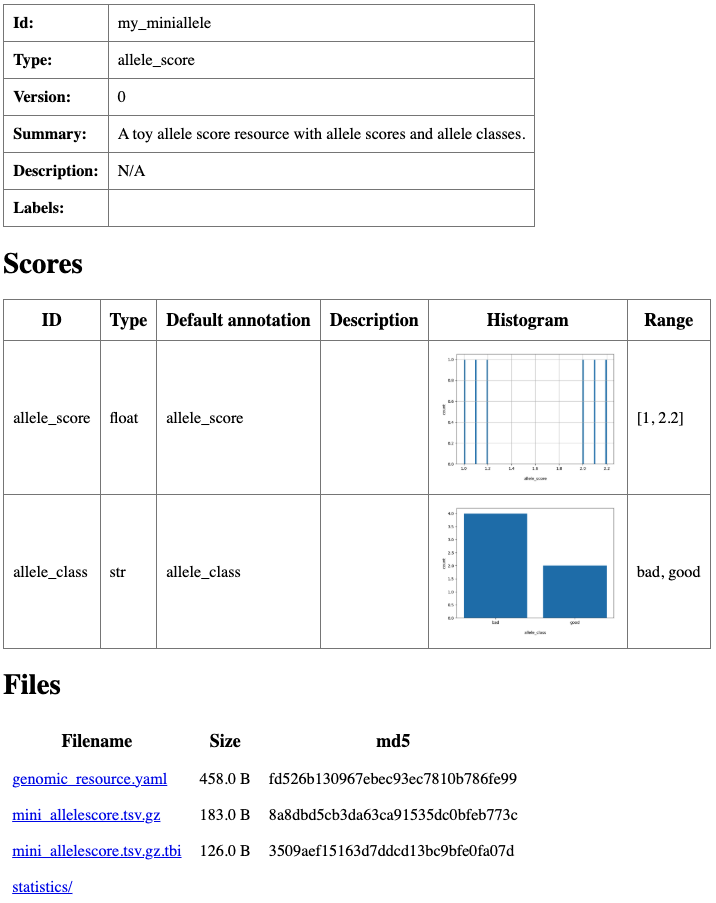
Summary html page created for my_miniallele resource.
7: Allele score (AlphaMissense)
Next, let’s create a real allele score resource. In your my_GRR directory, create a directory called my_allele:
mkdir my_allele
cd my_allele
We will use AlphaMissense, a deep-learning-based missense variant deleteriousness score. Download the AlphaMissense score file for hg38 genome:
curl -O https://zenodo.org/records/8208688/files/AlphaMissense_hg38.tsv.gz
A quick look at the downloaded file shows that the column names are listed on line four.
gzip -dc AlphaMissense_hg38.tsv.gz | head
# Copyright 2023 DeepMind Technologies Limited
#
# Licensed under CC BY-NC-SA 4.0 license
#CHROM      POS     REF     ALT     genome  uniprot_id      transcript_id   protein_variant am_pathogenicity        am_class
chr1        69094   G       T       hg38    Q8NH21  ENST00000335137.4       V2L     0.2937  likely_benign
chr1        69094   G       C       hg38    Q8NH21  ENST00000335137.4       V2L     0.2937  likely_benign
chr1        69094   G       A       hg38    Q8NH21  ENST00000335137.4       V2M     0.3296  likely_benign
chr1        69095   T       C       hg38    Q8NH21  ENST00000335137.4       V2A     0.2609  likely_benign
chr1        69095   T       A       hg38    Q8NH21  ENST00000335137.4       V2E     0.2922  likely_benign
chr1        69095   T       G       hg38    Q8NH21  ENST00000335137.4       V2G     0.203   likely_benign
GAIn expects the column headers on the first line. Accordingly, we decompress the file, strip the first three lines, write the processed content to a new file, and delete the original file to minimize disk usage.
gzip -dc AlphaMissense_hg38.tsv.gz \
| sed '1,3d' \
| bgzip > AlphaMissense_hg38_modified.tsv.gz
rm AlphaMissense_hg38.tsv.gz
A second look at the resource file confirms that the column names are on line 1.
bgzip -dc AlphaMissense_hg38_modified.tsv.gz | head -5
#CHROM      POS     REF     ALT     genome  uniprot_id      transcript_id   protein_variant am_pathogenicity        am_class
chr1        69094   G       T       hg38    Q8NH21  ENST00000335137.4       V2L     0.2937  likely_benign
chr1        69094   G       C       hg38    Q8NH21  ENST00000335137.4       V2L     0.2937  likely_benign
chr1        69094   G       A       hg38    Q8NH21  ENST00000335137.4       V2M     0.3296  likely_benign
chr1        69095   T       C       hg38    Q8NH21  ENST00000335137.4       V2A     0.2609  likely_benign
The resource is now ready to be included in a GRR. As is typical for allele resources, the chrom and pos columns
specify the genomic coordinates of the variant, while REF and ALT describe the variant itself.
AlphaMissense also provides genome, UniProt, and transcript identifiers, as well as the amino acid substitution caused
by the missense mutation (for example, the first variant changes valine to leucine). The last two columns report the
scoring results: am_pathogenicity provides the predicted effect of the variant on protein structure and function,
and am_class converts this score into categorical labels, with values below 0.34 classified as likely_benign and values above 0.564 as likely_pathogenic.
To index the resource by genomic coordinates, we run the following command:
tabix -s 1 -b 2 -e 2 AlphaMissense_hg38_modified.tsv.gz
Next, we create a text file called genomic_resource.yaml so that the resource is recognized
by GAIn. As a first step, we configure it to ingest only the am_pathogenicity scores from
the source file. In this YAML file, rather than using column indices, we explicitly specify
the column names corresponding to chromosome, position, reference, and alternative alleles.
We also customize the histogram generated by GAIn by setting the score range to 0-1
(the AlphaMissense score range), using 100 bins, and applying a logarithmic scale to the y-axis.
Finally, we define the interpretation of low and high scores, which will be displayed
on the summary page.
type: allele_score
allele_score_mode: substitutions

table:
  filename: AlphaMissense_hg38_modified.tsv.gz
  format: tabix
  zero_based: false

  chrom:
    name: CHROM
  pos_begin:
    name: POS
  pos_end:
    name: POS
  reference:
    name: REF
  alternative:
    name: ALT

scores:
- id: am_pathogenicity
  name: am_pathogenicity
  type: float
  desc: |
    AlphaMissense Pathogenicity score is a deleteriousness score for missense variants
  large_values_desc: "more pathogenic"
  small_values_desc: "less pathogenic"
  histogram:
    type: number
    number_of_bins: 100
    view_range:
      min: 0.0
      max: 1.0
    y_log_scale: True

meta:
  summary: Functional impact of mutations on protein function
At this point, GAIn can use the resource for annotation.
Running grr_manage resource-repair produces the following summary page,
which currently includes only the am_pathogenicity score.
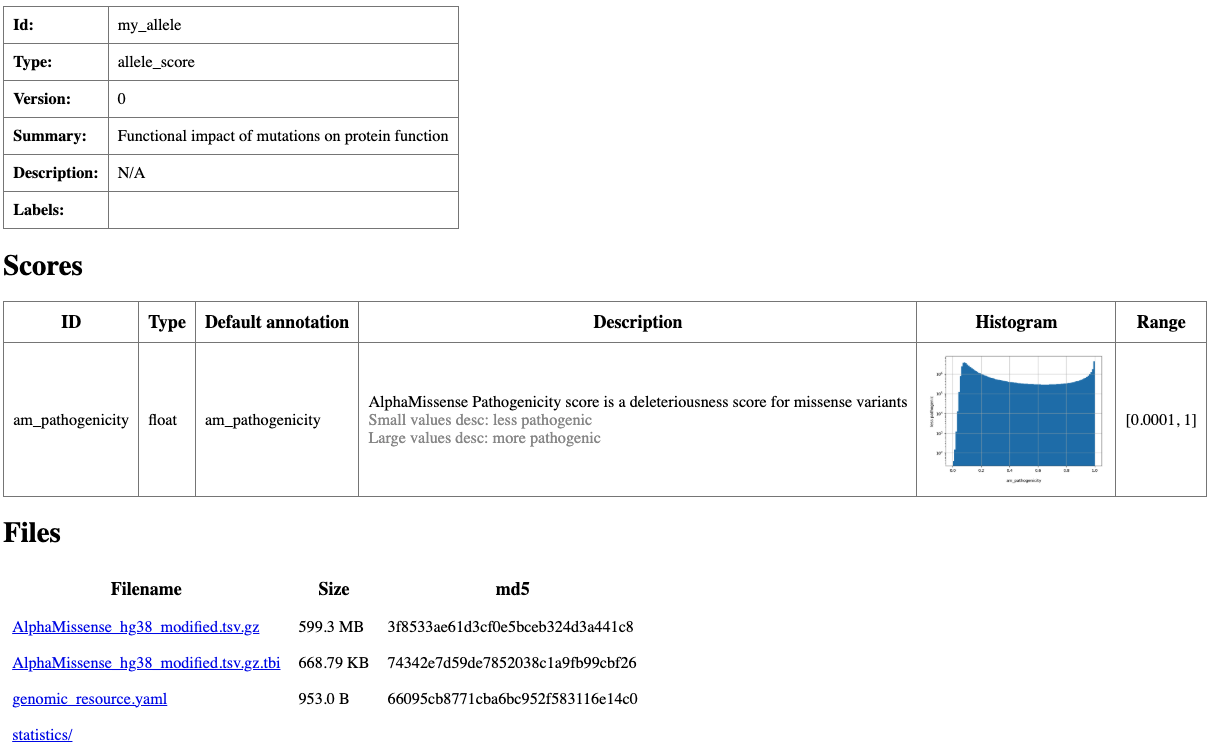
Summary html page created for my_allele resource.
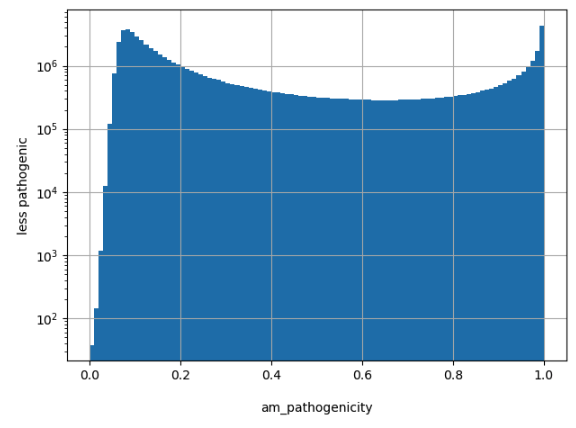
Histogram created for am_pathogenicity scores.
To include the am_class scores, add the following entries to the scores section,
configuring the histogram as categorical and enabling a log scale on the y-axis.
- id: am_class
  name: am_class
  type: str
  desc: |
    AlphaMissense Class is a deleteriousness category for missense variants
  histogram:
    type: categorical
    y_log_scale: True
Running grr_manage resource-repair with the updated genomic_resource.yaml
file produces the updated resource page shown below, now displaying both the
am_pathogenicity and am_class scores.
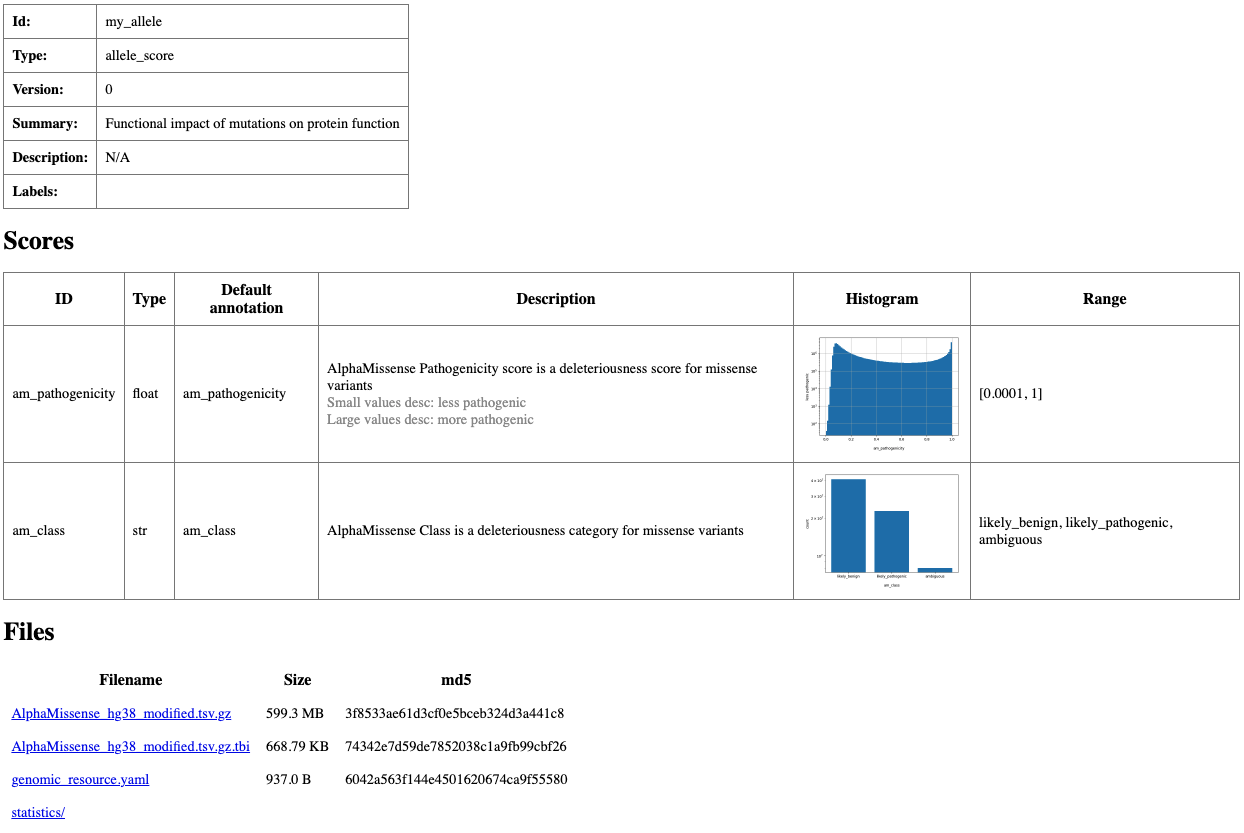
Updated summary HTML page created for my_allele resource.
8: Toy gene score
Back in the my_GRR directory, create a new folder for the resource and move into it:
mkdir my_minigenescore
cd my_minigenescore
Create a comma-separated file called my_minigenescore.csv with the following content:
gene,my_minigenescore
CHD8,9
TP53,3
CFTR,7
This resource provides a single score for three example genes.
Next, create a genomic_resource.yaml file in the same directory with this content:
type: gene_score
filename: my_minigenescore.csv

scores:
- id: my_minigenescore
  histogram:
    type: number

meta:
  summary: A custom gene score
  description: This is a custom gene score for demonstration purposes.
Finally, while still in the my_minigenescore directory, run:
grr_manage resource-repair
This command checks that the resource is usable for annotation and produces an HTML
summary file with basic descriptions and histograms for the my_minigenescore values.
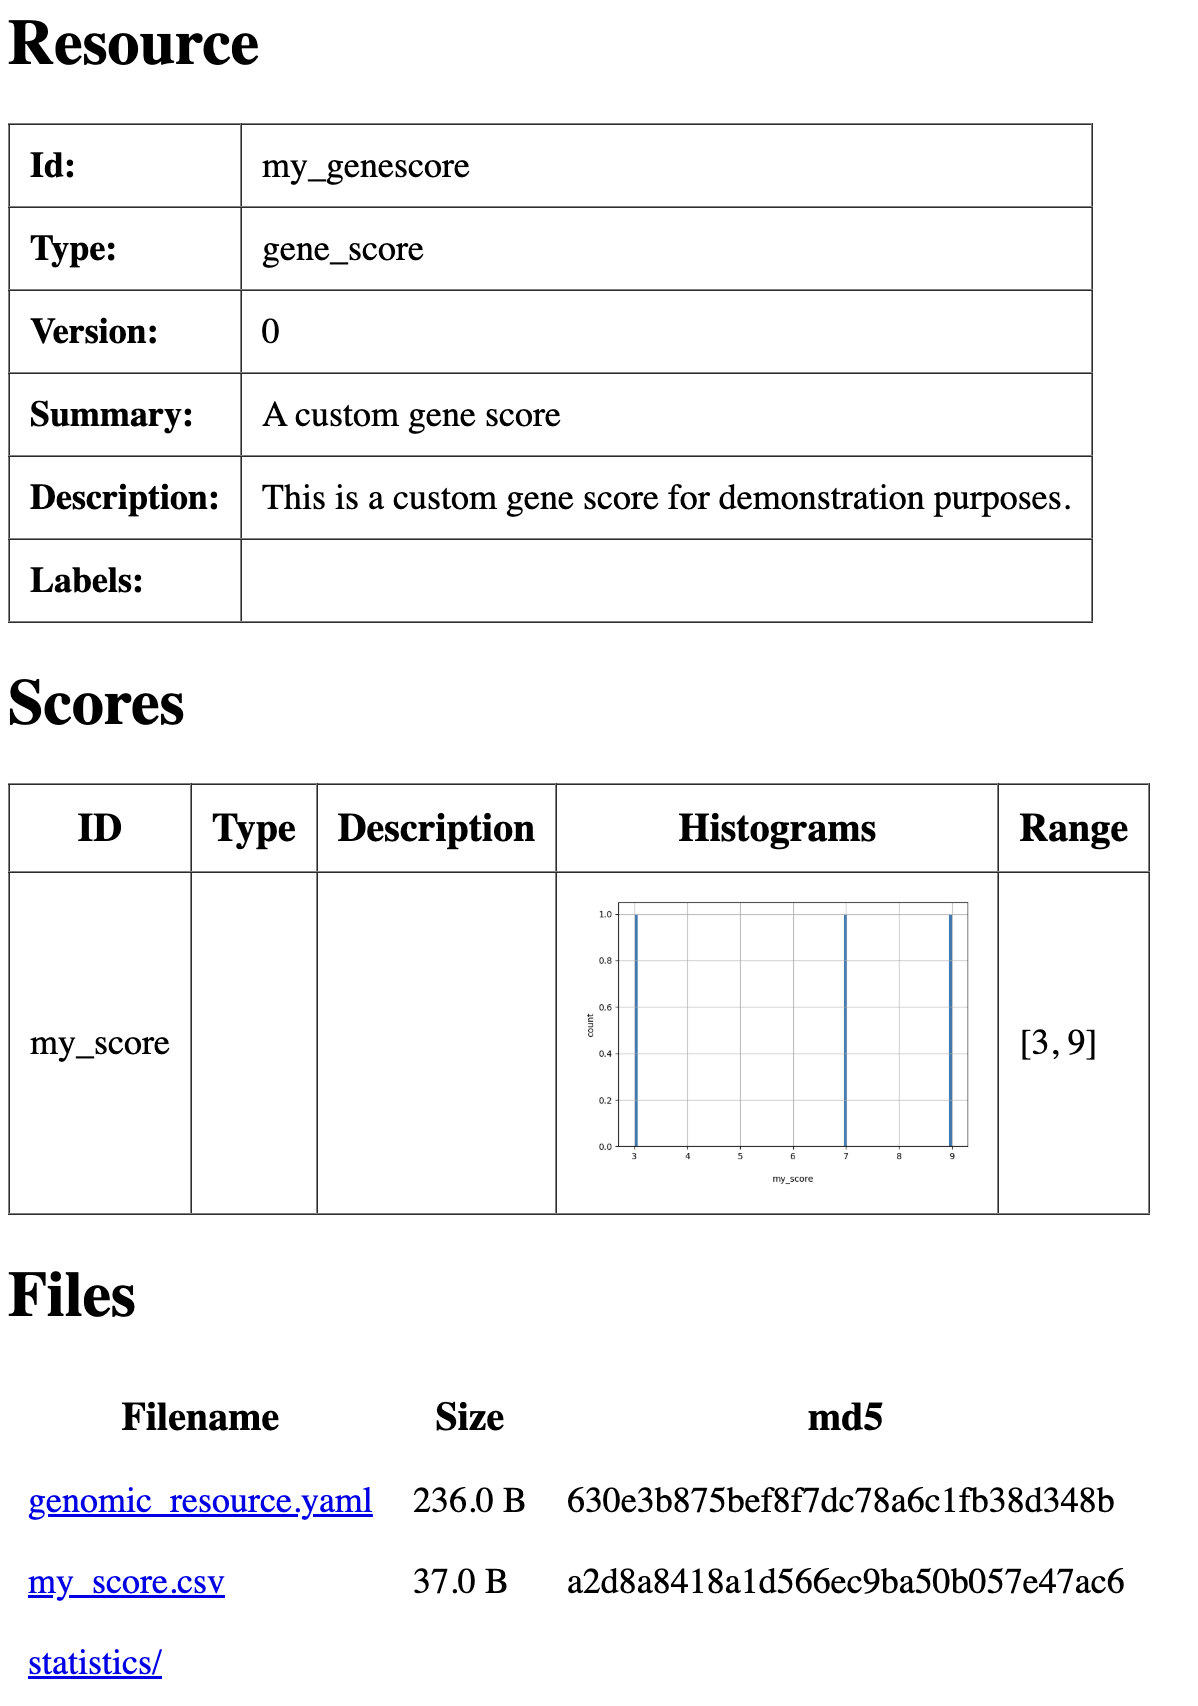
Summary html page created for my_minigenescore resource.
9: Gene score (pLI)
As a real-world example of a gene score, we use pLI (probability of loss-of-function intolerance), which reflects a gene’s sensitivity to loss-of-function mutations, with higher values indicating greater intolerance. The pLI score was introduced by Lek et al. in 2016.
Create a new folder for the resource and move into it:
mkdir my_genescore
cd my_genescore
At https://www.nature.com/articles/nature19057#Sec16, download the ZIP file containing the Supplementary Tables and unzip it. We focus on Supplementary Table 13, specifically the “Gene Constraint” sheet, which reports pLI scores and related constraint metrics for human genes. Run the following command to create a CSV file called pLI.csv. The file has two columns: the gene name and the corresponding pLI score. Before running the command, install openpyxl with mamba install openpyxl if it is not already installed.
python - <<'PY'
import pandas as pd

df = pd.read_excel(
    "nature19057-SI Table 13.xlsx",
    sheet_name="Gene Constraint",
    engine="openpyxl",
)

out = df[["gene", "pLI"]].copy()
out.to_csv("pLI.csv", index=False)
PY
The first few lines of pLI.csv will look like this:
gene,pLI
AGRN,0.17335234
NOC2L,1.33E-19
B3GALT6,0.048104466
C1orf159,0.090877636
ISG15,0.009847813
KLHL17,2.52E-07
PLEKHN1,2.02E-08
Next, create a genomic_resource.yaml file in the same directory with this content:
type: gene_score
filename: pLI.csv
scores:
- id: pLI
  desc: Probability of Loss-of-Function Intolerance
  small_values_desc: "less likely to be Loss-of-function intolerant"
  large_values_desc: "more likely to be Loss-of-function intolerant"
  histogram:
    type: number
    number_of_bins: 100
    view_range:
        min: 0
        max: 1
    x_min_log: 0.00001
    x_log_scale: false
    y_log_scale: true

meta:
  summary: Probability of Loss-of-Function Intolerance
  description: The probability of loss-of-function intolerance (pLI) score reflects a gene's sensitivity to LoF mutations.
Finally, while still in the my_genescore directory, run:
grr_manage resource-repair
This command checks that the resource is usable for annotation and produces an HTML
summary file with basic descriptions and histograms for the my_genescore values.
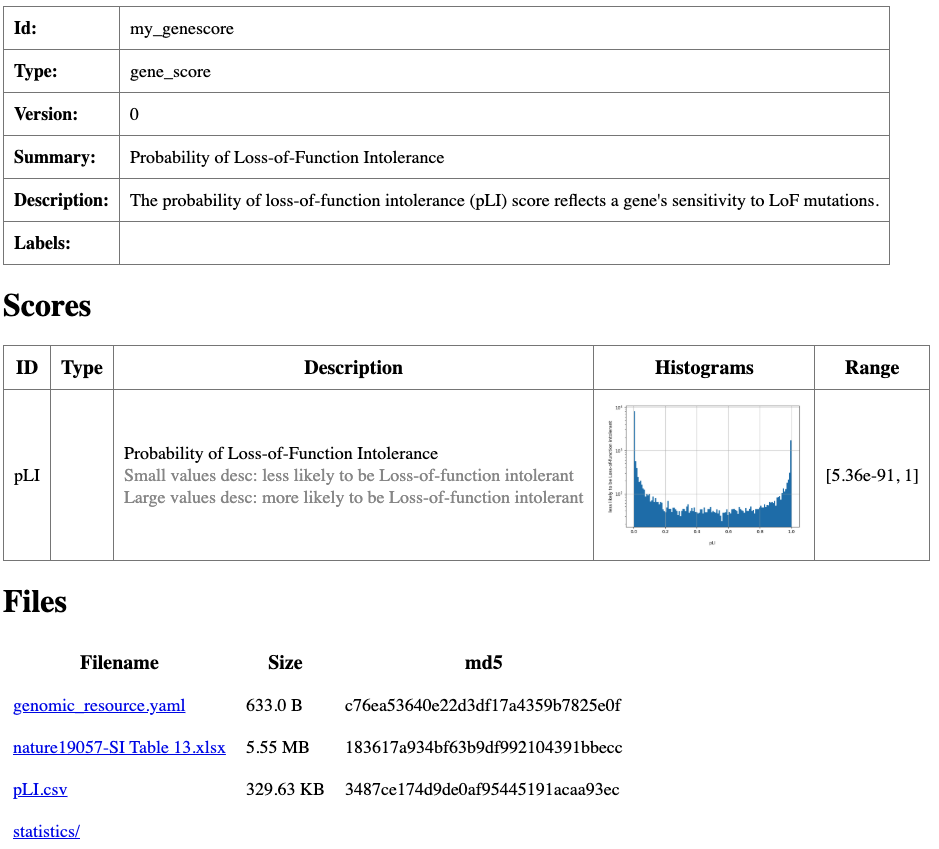
Summary html page created for my_genescore resource.
10: Toy gene sets
Gene set resources group biologically related genes and support membership and enrichment analyses. In GAIn, gene sets use a custom text representation. To illustrate how gene set resources are defined and used, we will create a toy gene set as a concrete example.
Create a new folder for the resource and move into it:
mkdir my_minigenesets
cd my_minigenesets
First, create another text file named map.txt with the following content.
This file defines gene-to-set memberships: the left column lists gene names, and the right column lists the set identifier(s) for each gene.
In this example, CHD8 and CFTR belong only to set 1, while TP53 belongs to sets 2 and 3.
CHD8        set_1
TP53        set_2 set_3
CFTR        set_3
Finally, make a genomic_resource.yaml file with the following content.
type: gene_set_collection
id: genesets
format: map
filename: map.txt

meta:
  summary: mini gene sets collection
Finally, while still in the my_minigenesets directory, run:
grr_manage resource-repair
This command checks that the resource is usable for annotation and produces
an HTML summary file with basic descriptions and histograms for the my_minigenesets resource.
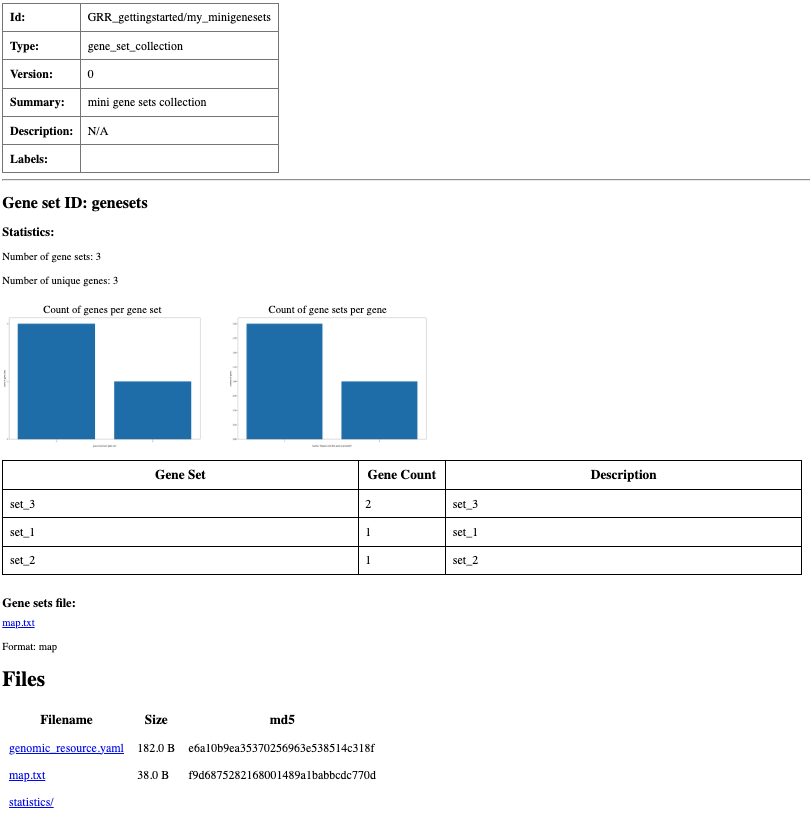
Summary html page created for my_minigenesets resource.
11: Gene sets (MSigDB)
As a real-world example of a gene set resource, we will create a MSigDB (Molecular Signatures Database) gene sets derived from a variety of curated sources. The Curated (C2) collection in MSigDB includes gene sets from canonical pathway databases (e.g., KEGG, Reactome, BioCarta) and from published gene expression studies, capturing well-defined pathways and perturbation signatures.
To create a gene sets resource for MSigDB, make a new folder for the resource and move into it:
mkdir my_genesets
cd my_genesets
Grab MSigDB gene sets in GMT format from the Broad Institute website:
curl -O https://data.broadinstitute.org/gsea-msigdb/msigdb/release/7.4/c2.all.v7.4.symbols.gmt
Prepare a genomic_resource.yaml with the following content to make the resource available in GAIn:
type: gene_set_collection
id: MSigDB_curated
format: gmt
filename: c2.all.v7.4.symbols.gmt
histograms:
genes_per_gene_set:
  type: number
  y_log_scale: True
gene_sets_per_gene:
  type: number
  y_log_scale: True
meta:
  summary: MSigDB (Molecular Signatures Database) gene sets
Finally, from inside the my_genesets directory, run:
grr_manage resource-repair
This validates the resource for annotation and generates an HTML summary page with basic descriptions and histograms for my_genesets.
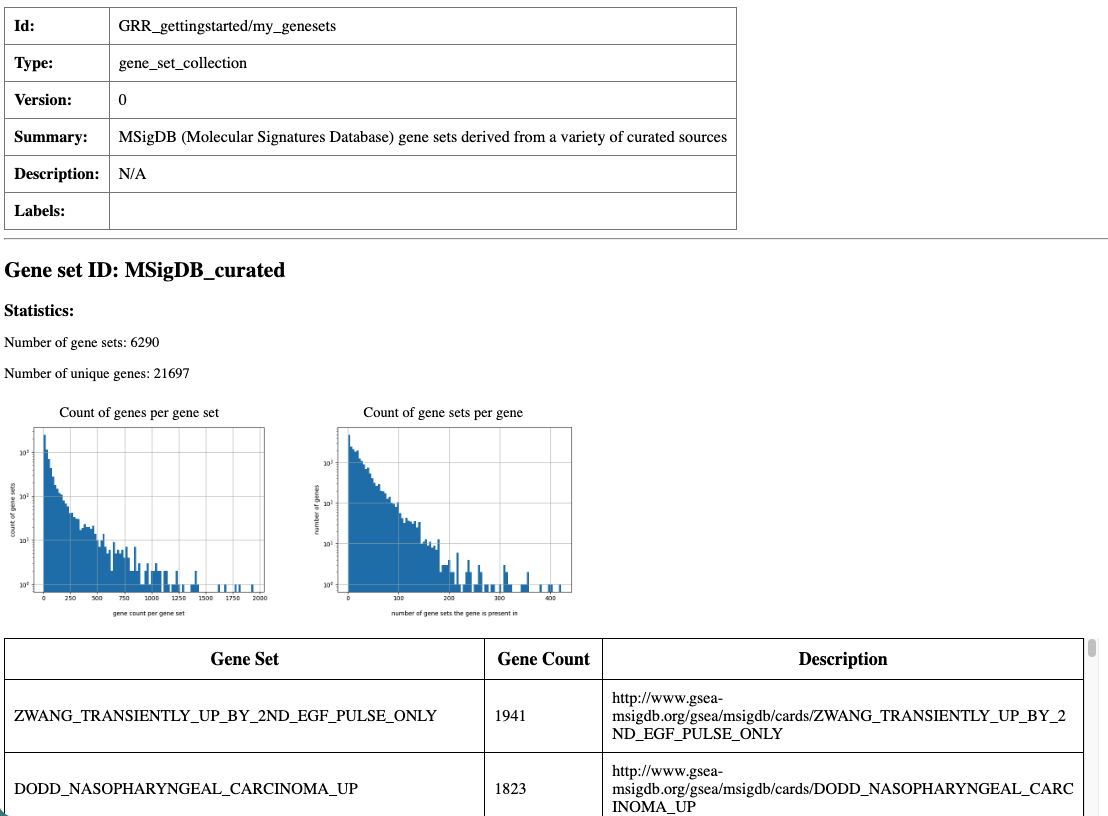
Partial screen shot of the summary html page created for my_genesets resource.
12: Toy fragment score
Copy-number variants (CNVs) are deletions or duplications of genomic segments. In GAIn, CNV data can be represented using fragment score resources, which consist of a tabular file and a YAML definition specifying the genomic intervals and associated annotation attributes.
Create a new folder for the resource and move into it:
mkdir my_minifragmentscore
cd my_minifragmentscore
Run the following command to create a tab-separated file called my_minifragmentscore.txt. The file has six columns: chromosome name, start position, end position, CNV name, deletion/duplication class, and frequency.
cat <<'EOF' | awk 'BEGIN{OFS="\t"} {print $1,$2,$3,$4,$5,$6}' > my_minifragmentscore.txt
chrom   pos_beg pos_end CNV_name          deletion_duplication frequency
chr1    3       15      Chr1_duplication  Duplication           0.1
chr2    5       15      Chr2_duplication  Deletion              0.2
EOF
This file defines two example fragments, corresponding to CNVs. Each row specifies an interval (chrom, pos_beg, pos_end), a CNV identifier (CNV_name), the CNV type (deletion_duplication) and frequency.
Next, create a genomic_resource.yaml file in the same directory with this content:
type: fragment_score
table:
  filename: my_minifragmentscore.txt

scores:
- id: CNV type
  name: deletion_duplication
  type: str
  desc: duplication or deletion
- id: CNV frequency
  name: frequency
  type: float
  desc: CNV frequency

meta:
  summary: toy fragment score resource
In this resource, the interval columns (chrom, pos_beg, pos_end) are stored in the table and used for overlap queries, while the two fields listed under scores (CNV type and CNV frequency) are exposed as attributes that can be emitted in annotation output.
Finally, while still in the my_minifragmentscore directory, run:
grr_manage resource-repair
This command checks that the resource is usable for annotation and produces an HTML summary file with basic descriptions for the fragment score resource.
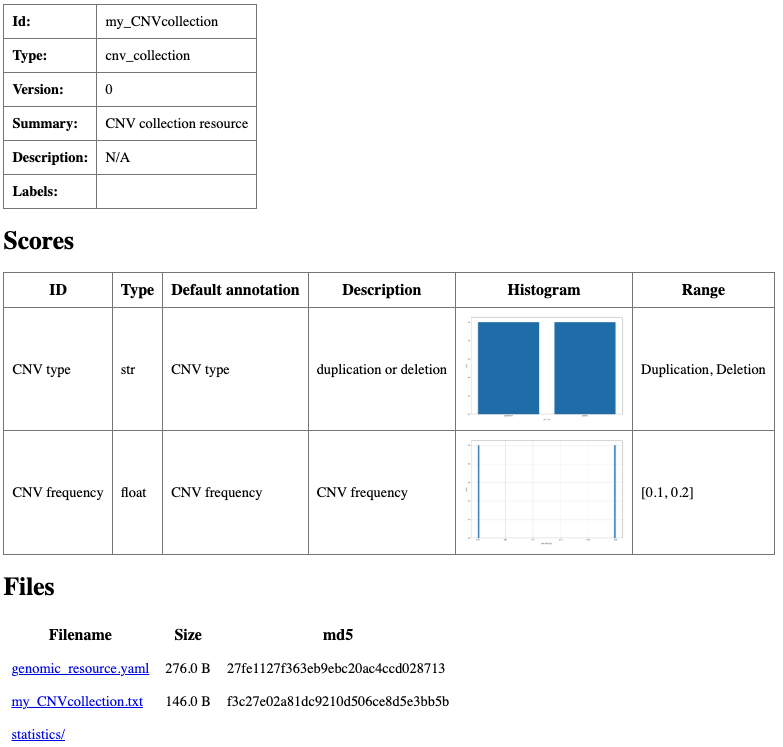
Partial display of summary html page created for my_minifragmentscore resource.
13: Fragment score (Iossifov 2021)
As a real-world example, we will build a fragment score resource from Supplementary Data 4 of Yoon et al. (2021), which lists the de novo CNVs included in their analysis from WGS of SSC (simplex) and AGRE (multiplex) families.
Create a new folder for the resource and move into it:
mkdir my_fragmentscore
cd my_fragmentscore
First download the resource file:
curl -O https://static-content.springer.com/esm/art%3A10.1038%2Fs42003-021-02533-z/MediaObjects/42003_2021_2533_MOESM6_ESM.xlsx
This command downloads an Excel workbook with two sheets. In this example, we use the “De novo CNV in SSC and AGRE” sheet, which contains the de novo CNV intervals and associated metadata.
UCSCLink |
collection |
familyId |
in affected status |
personIds |
location |
variant |
size |
publicaton |
genomic region |
number of genes |
genes |
|---|---|---|---|---|---|---|---|---|---|---|---|
LINK |
SSC |
12613 |
affected |
12613.p1 |
chr1:1305145-1314126 |
duplication |
8982 |
coding |
3 |
ACAP3,INTS11,PUSL1 |
|
LINK |
AGRE |
AU2725202_AU2725201 |
affected |
AU2725301 |
chr1:3069177-4783791 |
duplication |
1714615 |
coding |
13 |
AJAP1,ARHGEF16,C1orf174,CCDC27,CEP104,DFFB,LRRC47,MEGF6,PRDM16,SMIM1,TP73,TPRG1L,WRAP73 |
|
LINK |
SSC |
13424 |
unaffected |
13424.s1 |
chr1:3975501-3977800 |
deletion |
2300 |
intergenic |
0 |
||
LINK |
SSC |
12852 |
affected |
12852.p1 |
chr1:6647401-6650500 |
deletion |
3100 |
inter-coding_intronic |
1 |
DNAJC11 |
|
LINK |
SSC |
13776 |
affected |
13776.p1 |
chr1:8652301-8657600 |
deletion |
5300 |
coding |
1 |
RERE |
|
LINK |
SSC |
13373 |
unaffected |
13373.s1 |
chr1:9992001-9994100 |
deletion |
2100 |
intergenic |
0 |
The downloaded table does not include explicit chrom, pos_beg, or pos_end columns.
Instead, these coordinates are encoded in the location field (for example, chr1:1305145-1314126).
Run the script below in your terminal to split location into chrom, pos_beg, and pos_end,
retain the variant and size columns, and write the result to a tab-separated file
named Iossifov_Lab_SSC_AGRE_2021.tsv (before running the script, install openpyxl by mamba install openpyxl).
python - <<'PY'
import pandas as pd
df = pd.read_excel(
    "42003_2021_2533_MOESM6_ESM.xlsx",
    sheet_name="De novo CNV in SSC and AGRE",
    dtype=str,
)
coords = df["location"].str.extract(r"^(chr[^:]+):(\d+)-(\d+)$")
coords.columns = ["chrom", "pos_beg", "pos_end"]
out = pd.DataFrame({
    "chrom": coords["chrom"],
    "pos_beg": coords["pos_beg"].astype(int),
    "pos_end": coords["pos_end"].astype(int),
    "variant": df["variant"],
    "size": df["size"].astype(int),
})
out.to_csv("Iossifov_Lab_SSC_AGRE_2021.tsv", sep="\t", index=False)
PY
After running the script, inspect Iossifov_Lab_SSC_AGRE_2021.tsv to confirm the coordinate columns (chrom, pos_begin, and pos_end) and attribute columns.
chrom |
pos_beg |
pos_end |
variant |
size |
|---|---|---|---|---|
chr1 |
1305145 |
1314126 |
duplication |
8982 |
chr1 |
3069177 |
4783791 |
duplication |
1714615 |
chr1 |
3975501 |
3977800 |
deletion |
2300 |
chr1 |
6647401 |
6650500 |
deletion |
3100 |
chr1 |
8652301 |
8657600 |
deletion |
5300 |
chr1 |
9992001 |
9994100 |
deletion |
2100 |
Prepare a genomic_resource.yaml with the following content to make the resource available in GAIn:
type: fragment_score
table:
  filename: Iossifov_Lab_SSC_AGRE_2021.tsv

scores:
- id: CNV_type
  name: variant
  type: str
  desc: CNV type
- id: CNV_size
  name: size
  type: int
  desc: CNV size
  histogram:
    type: number
    y_log_scale: True

meta:
  summary: Iossifov Lab SSC AGRE 2021 fragment score
Finally, while still in the resource directory, run:
grr_manage resource-repair
This command validates the fragment score resource for use in annotation and generates an HTML summary page with basic descriptions and any available statistics for the fragment score resource.
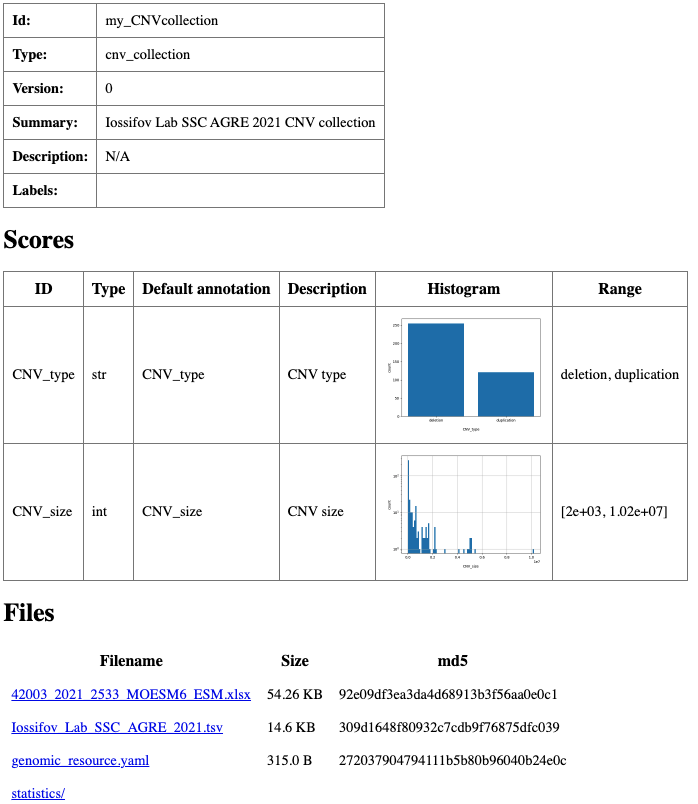
Partial display of summary html page created for my_fragmentscore resource.
Browse the local GRR
After creating the resources above, the local GRR contains 13 resources covering several GRR resource types, including genomes, gene models, position scores, allele scores, gene scores, gene sets, and fragment scores. When you run grr_manage repo-repair from the main local GRR directory (my_GRR), it will produce an HTML summary page, index.html, that provides a convenient way to browse the repository. This page lists the resources in a searchable table, including their type, ID, version, total size, and summary.
This summary page is a useful checkpoint before running annotation. The resource IDs shown in the table are the same IDs used in annotation pipeline files, such as my_genome, my_genemodel, my_position, my_allele, and my_genescore. The Table view lists each resource in the GRR, showing its resource type, ID, version, total size, and summary, and also allows the resources to be searched and filtered by type.
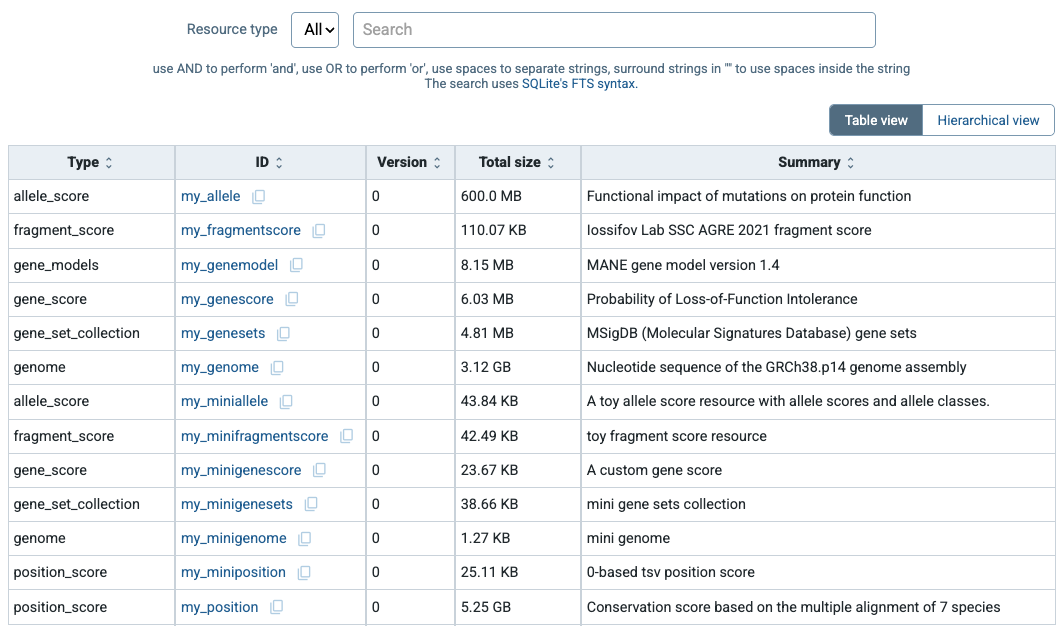
Repository-level summary page for my_GRR viewed in Table view, which lists the local resources and allows searching by resource type, resource ID, or summary.
Hierarchical view organizes resources according to the folder structure of the GRR, allowing users to define and browse resources in a hierarchy that reflects how they have chosen to organize them. The search box and type filter apply here as well as in the Table view. With either of them set, the tree is pruned to the resources that match: folders with no match are dropped, the folders leading to a match are kept so it can still be reached, and each remaining folder reports how many matches it holds and how much they take up rather than its full contents. Clearing both restores the whole listing. Since my_GRR uses a flat folder structure, the hierarchy shown here is minimal. The Hierarchical view becomes more useful when related resources are grouped into folders—for example, by placing gene scores, position scores, or other related resources under separate folders—making larger repositories easier to browse.
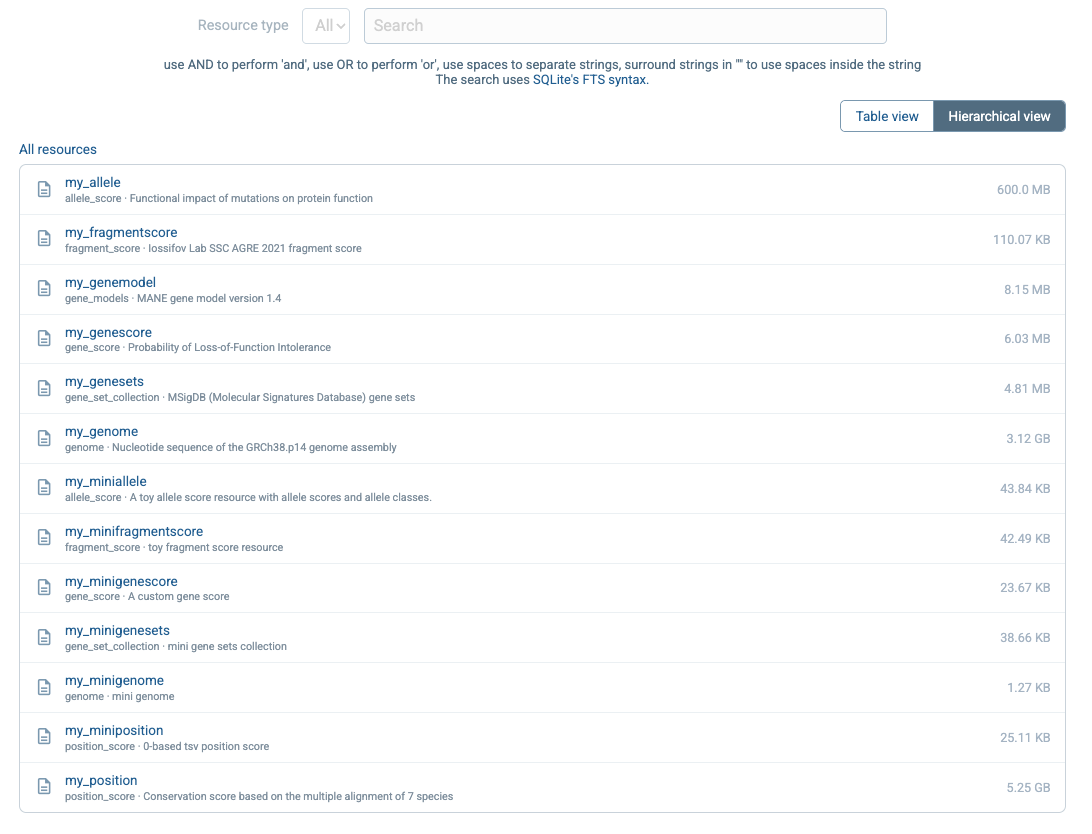
Repository-level summary page for my_GRR viewed in Hierarchical view, which organizes local resources according to the folder structure of the GRR.
Annotate using the local GRR
Your local GRR is now ready to support annotation. The examples above added several local resources, including genomes, gene models, position scores, and allele scores. Since my_GRR is listed in ~/.grr_definition.yaml, GAIn can use these resources during annotation. The example below uses the local resources created in this guide.
Create a file named annotation_pipeline_local.yaml with the following content:
preamble:
  summary: Local pipeline
  input_reference_genome: my_genome

annotators:
- effect_annotator:
    gene_models: my_genemodel
    attributes:
    - worst_effect
    - gene_list
    - genes

- position_score_annotator:
    resource_id: my_position

- normalize_allele_annotator

- allele_score_annotator:
    resource_id: my_allele
    input_annotatable: normalized_allele

- gene_score_annotator:
    resource_id: my_genescore
    input_gene_list: gene_list
Run the following command to annotate your variants using this pipeline:
annotate_tabular small_input.csv annotation_pipeline_local.yaml -o variants_local_annotated.csv
This command creates a file named variants_local_annotated.csv with the following content:
chrom |
pos |
ref |
alt |
worst_effect |
genes |
phyloP7way |
am_pathogenicity |
am_class |
pLI |
|---|---|---|---|---|---|---|---|---|---|
chr14 |
21415880 |
G |
A |
nonsense |
CHD8 |
0.917 |
CHD8:1 |
||
chr17 |
7674904 |
TCT |
T |
frame-shift |
TP53 |
-0.12 |
TP53:0.912 |
||
chr7 |
117587806 |
G |
A |
missense |
CFTR |
0.917 |
0.99 |
likely_pathogenic |
CFTR:2.96e-36 |
mini-GRR: a template GRR
Defining new genomic resources can feel abstract at first: different resource types expect different file formats, coordinate conventions, and configuration options in genomic_resource.yaml. To make these patterns easier to inspect, we provide mini-GRR, a small, self-contained Genomic Resource Repository that can be used as a template or reference.
You can clone mini-GRR with:
git clone git@github.com:iossifovlab/mini-GRR.git
cd mini-GRR
mini-GRR contains a toy genome with ready-made genomic_resource.yaml descriptors, plus minimal examples of gene models, position scores, allele scores, gene scores, gene sets, and fragment scores. The resources span common file types, such as TSV/tabix, BedGraph/BigWig, and VCF, and include both 0-based and 1-based coordinate conventions.
To use mini-GRR with GAIn, add it to your ~/.grr_definition.yaml file in the same way as any other local GRR:
id: development
type: group
children:
- id: mini-GRR
  type: directory
  directory: <path_to_mini_grr>/mini-GRR
Once configured, you can browse and run pipelines against mini-GRR to verify that your GAIn installation and GRR configuration work as expected. After you understand how a resource is structured, you can use the corresponding mini-GRR example as a starting point for your own data by replacing the toy files and editing genomic_resource.yaml. In this way, mini-GRR provides a compact reference for GRR directory layout, metadata fields, and resource configuration.
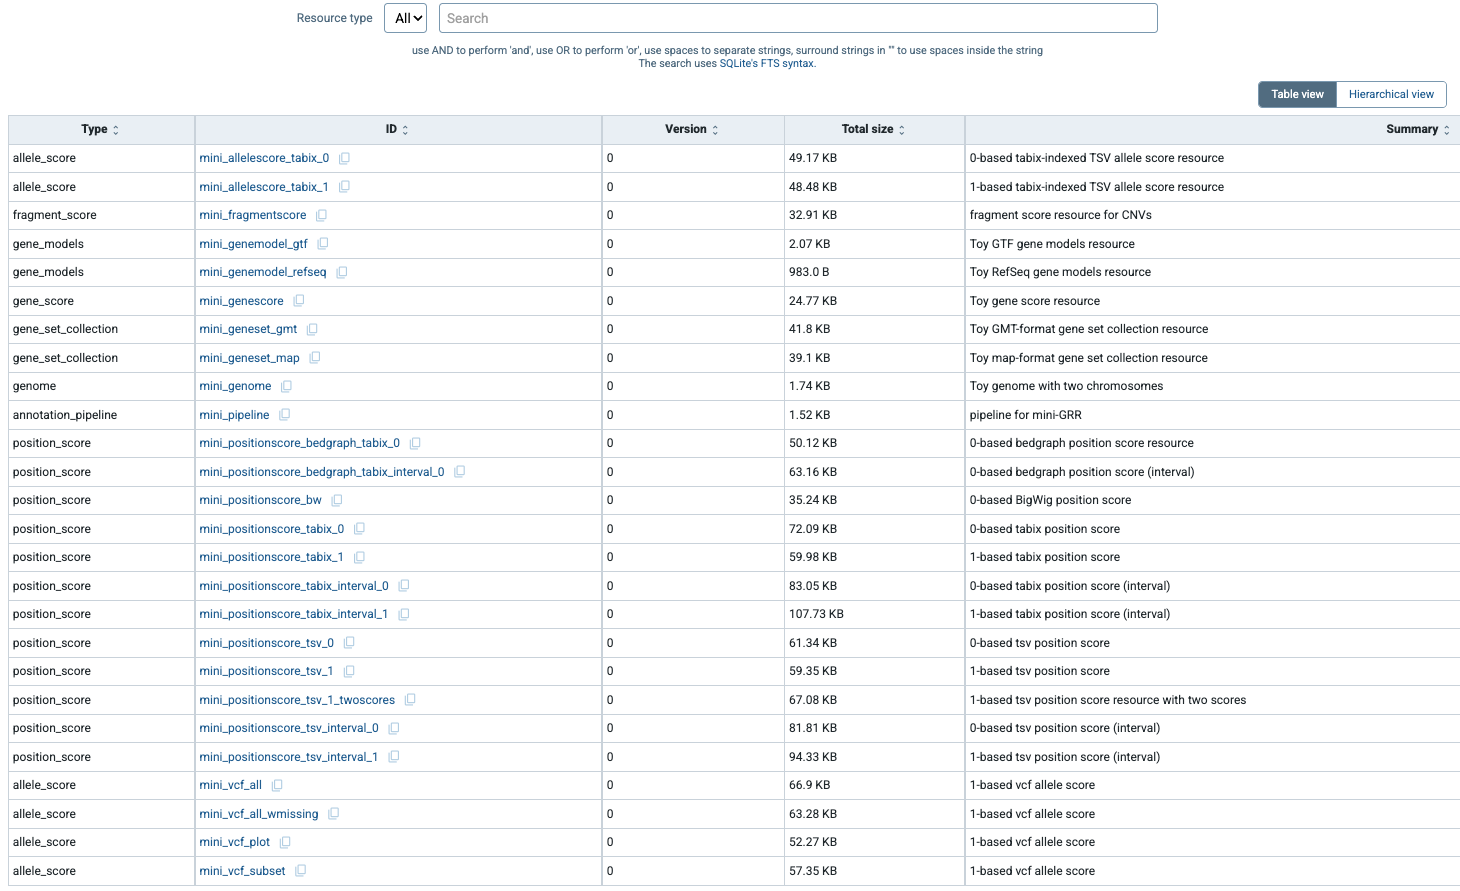
Browsing the mini-GRR index.html page provides a quick way to explore the repository before examining individual resource directories. As shown below, the Table view brings the toy resources together in a searchable overview, making it easy to locate examples of different resource types and use them as starting points for configuring new resources.